Club Men's USAU Rankings
2024-25 Season
Data updated through May 4 at 8:45pm EDT (some scores likely missing)
GL 1 · MA 1 · NC 1 · NE 3 · NW 4 · SC 2 · SE 3 · SW 1
| Rank | Change | Team | Record | Rating | Change | Region | Conference | SoS | PDC | % |
|---|---|---|---|---|---|---|---|---|---|---|
| 1 | Truck Stop MA 1 | 5-1 | 2485.65 | 21 | Mid-Atlantic | Capital | 2134.29 | 351.36 | 0.16 | |
| 2 | Chicago Machine GL 1 | 9-1 | 2414.75 | 20 | Great Lakes | Central Plains | 2082.28 | 332.46 | 0.16 | |
| 3 | Ring of Fire SE 1 | 7-2 | 2238.75 | 19 | Southeast | North Carolina | 2017.52 | 221.23 | 0.11 | |
| 4 | Rhino Slam! NW 1 | 14-2 | 2224.18 | 25 | Northwest | Oregon | 1895.12 | 329.07 | 0.17 | |
| 5 | Sockeye NW 2 | 15-3 | 2168.44 | 22 | Northwest | Washington/BC | 1871.08 | 297.37 | 0.16 | |
| 6 | DiG NE 1 | 6-4 | 2154.21 | 20 | Northeast | East New England | 2101.26 | 52.94 | 0.03 | |
| 7 | Revolver SW 1 | 6-4 | 2127.49 | 21 | Southwest | NorCal | 2071.79 | 55.7 | 0.03 | |
| 8 | PoNY NE 2 | 6-5 | 2103.89 | 19 | Northeast | Metro NY | 2055.77 | 48.12 | 0.02 | |
| 9 | GOAT NE 3 | 10-2 | 2100.3 | 19 | Northeast | Upstate NY | 1723.87 | 376.42 | 0.22 | |
| 10 | Johnny Bravo SC 1 | 1-2 | 2091.13 | 20 | South Central | Rocky Mountain | 2241.14 | -150 | -0.07 | |
| 11 | Doublewide SC 2 | 9-3 | 2038.81 | 16 | South Central | Texas | 1914.19 | 124.62 | 0.07 | |
| 12 | Chain Lightning SE 2 | 7-5 | 1989.74 | 19 | Southeast | East Coast | 1816.31 | 173.44 | 0.1 | |
| 13 | Furious George NW 3 | 8-4 | 1983.24 | 20 | Northwest | Washington/BC | 1793.53 | 189.71 | 0.11 | |
| 14 | Raleigh-Durham United SE 3 | 6-6 | 1936.76 | 18 | Southeast | North Carolina | 1917.2 | 19.56 | 0.01 | |
| 15 | Mephisto | 5-1 | 1896.79 | 17 | 1582.13 | 314.66 | 0.2 | |||
| 16 | Shrimp NW 4 | 11-1 | 1870.08 | 14 | Northwest | Big Sky | 1357.95 | 512.13 | 0.38 | |
| 17 | Sprout | 14-5 | 1835.03 | 18 | Northeast | West New England | 1603.6 | 231.43 | 0.14 | |
| 18 | Vault | 6-6 | 1830.82 | 18 | Mid-Atlantic | Capital | 1838.12 | -7.3 | 0 | |
| 19 | Sub Zero NC 1 | 6-6 | 1828.58 | 18 | North Central | Northwest Plains | 1799.11 | 29.46 | 0.02 | |
| 20 | Dark Star-D | 10-8 | 1827.51 | 17 | Northwest | Oregon | 1816.76 | 10.75 | 0.01 | |
| 21 | Mad Men | 13-5 | 1819.37 | 19 | North Central | Northwest Plains | 1663.39 | 155.98 | 0.09 | |
| 22 | Mallard | 11-7 | 1799.86 | 21 | North Central | Northwest Plains | 1722.98 | 76.88 | 0.04 | |
| 23 | SoCal Condors | 9-8 | 1798.11 | 21 | Southwest | So Cal | 1956.24 | -158.13 | -0.08 | |
| 24 | Blueprint | 11-7 | 1768.13 | 22 | Northeast | Metro NY | 1709.02 | 59.11 | 0.03 | |
| 25 | Phoenix | 7-5 | 1733.73 | 21 | Northeast | Upstate NY | 1696 | 37.73 | 0.02 | |
| 26 | Red Tide | 11-2 | 1722.89 | 17 | Northeast | East New England | 1489.04 | 233.84 | 0.16 | |
| 27 | 2 | Fungi | 15-2 | 1711.49 | 12 | South Central | Rocky Mountain | 1358.3 | 353.19 | 0.26 |
| 28 | 1 | General Strike | 5-1 | 1708.59 | 19 | 1433.73 | 274.87 | 0.19 | ||
| 29 | 1 | Garden State Ultimate | 8-10 | 1690.68 | 19 | Mid-Atlantic | Founders | 1802.97 | -112.3 | -0.06 |
| 30 | Pittsburgh Temper | 11-7 | 1658.36 | 18 | Mid-Atlantic | Founders | 1588.34 | 70.02 | 0.04 | |
| 31 | Flying Dutchmen | 17-2 | 1635.56 | 16 | Great Lakes | East Plains | 1350.13 | 285.44 | 0.21 | |
| 32 | Lounar | 10-8 | 1631.79 | 19 | North Central | West Plains | 1599.62 | 32.17 | 0.02 | |
| 33 | 1 | Florida Untied | 9-4 | 1585.6 | 17 | Southeast | Florida | 1479.3 | 106.3 | 0.07 |
| 34 | 1 | Phantom | 9-9 | 1585.43 | 20 | Mid-Atlantic | Founders | 1637.25 | -51.83 | -0.03 |
| 35 | Scoop | 4-8 | 1578.43 | 18 | Northeast | East New England | 1627.35 | -48.91 | -0.03 | |
| 36 | Shade | 16-3 | 1572.17 | 17 | Northeast | Metro NY | 1289.91 | 282.26 | 0.22 | |
| 37 | Cash Crop 2 | 10-3 | 1567.45 | 18 | Southeast | North Carolina | 1514.54 | 52.9 | 0.03 | |
| 38 | Oak Grove Boys | 7-11 | 1565.83 | 19 | Mid-Atlantic | Capital | 1622.13 | -56.3 | -0.03 | |
| 39 | 1 | Trident | 7-11 | 1558.86 | 20 | Great Lakes | Central Plains | 1569.57 | -10.71 | -0.01 |
| 40 | 1 | Omen | 8-10 | 1552.48 | 19 | Great Lakes | East Plains | 1568.63 | -16.15 | -0.01 |
| 41 | 2 | ISO Atmo | 13-5 | 1549.23 | 35 | South Central | Rocky Mountain | 1360.78 | 188.45 | 0.14 |
| 42 | Beacon | 10-8 | 1535.99 | 17 | Great Lakes | East Plains | 1574.9 | -38.91 | -0.02 | |
| 43 | Public Menemy | 6-1 | 1530.22 | 15 | 1206.25 | 323.97 | 0.27 | |||
| 44 | Alliance | 18-3 | 1519.49 | 19 | Southeast | Gulf Coast | 1247.18 | 272.3 | 0.22 | |
| 45 | Alamode | 11-8 | 1506.76 | 18 | South Central | Texas | 1439.68 | 67.09 | 0.05 | |
| 46 | 10 | SOUF | 10-2 | 1502.47 | 44 | Northwest | Washington/BC | 1181.59 | 320.89 | 0.27 |
| 47 | 1 | Hazard | 6-6 | 1497.85 | 12 | Southwest | So Cal | 1543.86 | -46.02 | -0.03 |
| 48 | 1 | Kansas City Smokestack | 14-5 | 1489.74 | 18 | North Central | West Plains | 1307.06 | 182.68 | 0.14 |
| 49 | 1 | OAT | 7-4 | 1488.82 | 9 | Southwest | NorCal | 1387.34 | 101.48 | 0.07 |
| 50 | 1 | Zyzzyva | 5-5 | 1477.56 | 19 | Southwest | NorCal | 1607.91 | -130.35 | -0.08 |
| 51 | 1 | baNC | 14-6 | 1475.94 | 20 | Southeast | North Carolina | 1216.37 | 259.58 | 0.21 |
| 52 | 1 | Chimney | 14-5 | 1474.91 | 17 | Great Lakes | East Plains | 1257.96 | 216.95 | 0.17 |
| 53 | Switchback | 11-13 | 1470.51 | 10 | Northwest | Washington/BC | 1453.98 | 16.53 | 0.01 | |
| 54 | 2 | Haymaker | 12-6 | 1464.17 | 17 | Great Lakes | Central Plains | 1280.55 | 183.62 | 0.14 |
| 55 | 1 | Club M - Manic | 10-3 | 1462.6 | 18 | Northeast | West New England | 1223.93 | 238.67 | 0.2 |
| 56 | 1 | I-69 | 18-1 | 1451.81 | 17 | Great Lakes | Central Plains | 1013.4 | 438.41 | 0.43 |
| 57 | Colt | 8-4 | 1428.5 | 17 | Northeast | Metro NY | 1389.42 | 39.08 | 0.03 | |
| 58 | 1 | Riverside | 14-5 | 1417.04 | 14 | South Central | Texas | 1218.2 | 198.84 | 0.16 |
| 59 | 1 | Little Red Wagon | 11-3 | 1412.33 | 20 | Southeast | East Coast | 1177.56 | 234.77 | 0.2 |
| 60 | Zoboomafoo | 15-5 | 1410.75 | 18 | North Central | Northwest Plains | 1132.27 | 278.48 | 0.25 | |
| 61 | 3 | Red Circus | 4-3 | 1386.67 | 15 | 1314.06 | 72.61 | 0.06 | ||
| 62 | Colonels | 4-8 | 1386.07 | 19 | Great Lakes | East Plains | 1581.36 | -195.3 | -0.12 | |
| 63 | Lost Boys | 19-2 | 1382.93 | 19 | Southeast | East Coast | 1082.87 | 300.06 | 0.28 | |
| 64 | 4 | Junco | 14-5 | 1371.74 | 21 | Northwest | Oregon | 1168.35 | 203.39 | 0.17 |
| 65 | 2 | Ghostbusters | 4-2 | 1355.59 | 13 | 1136.87 | 218.72 | 0.19 | ||
| 66 | 5 | Blackfish | 3-4 | 1355.17 | 50 | 1408.63 | -53.45 | -0.04 | ||
| 67 | 1 | Tanasi | 5-8 | 1354.63 | 18 | Southeast | East Coast | 1587.03 | -232.4 | -0.15 |
| 68 | 1 | Knights of Ni | 13-7 | 1329.2 | 19 | North Central | Northwest Plains | 1214.52 | 114.68 | 0.09 |
| 69 | 3 | Johnny Walker | 1-3 | 1328.83 | 8 | 1490.67 | -161.85 | -0.11 | ||
| 70 | (washed) | 6-4 | 1328.58 | 18 | South Central | Rocky Mountain | 1176.17 | 152.41 | 0.13 | |
| 71 | H.I.P | 11-9 | 1324.45 | 15 | South Central | Texas | 1409.14 | -84.69 | -0.06 | |
| 72 | 2 | Big Wrench | 7-6 | 1301.67 | 17 | Northeast | East New England | 1299.93 | 1.74 | 0 |
| 73 | 3 | Texas Duffy | 13-6 | 1298.97 | 6 | South Central | Texas | 1176.28 | 122.68 | 0.1 |
| 74 | 1 | Town Hall Stars | 15-1 | 1298.22 | 10 | Mid-Atlantic | Capital | 961.18 | 337.04 | 0.35 |
| 75 | 2 | Brawl | 8-11 | 1297.32 | 28 | South Central | Texas | 1428.89 | -131.58 | -0.09 |
| 76 | 1 | Lantern | 12-7 | 1274.96 | 17 | Northeast | East New England | 1217.89 | 57.07 | 0.05 |
| 77 | 1 | Surly Cynic | 5-1 | 1263.67 | 19 | 957.64 | 306.03 | 0.32 | ||
| 78 | 1 | Sawtooth | 10-9 | 1261.94 | 17 | Northwest | Big Sky | 1143.8 | 118.13 | 0.1 |
| 79 | 1 | Skipjack | 4-8 | 1246.75 | 19 | Southwest | So Cal | 1344.72 | -97.97 | -0.07 |
| 80 | 2 | Grand Trunk | 4-2 | 1238.15 | 14 | 1079.43 | 158.72 | 0.15 | ||
| 81 | 2 | Clutch | 15-5 | 1215.94 | 15 | South Central | Texas | 939.99 | 275.96 | 0.29 |
| 82 | 17 | Portland TremOR | 7-6 | 1208.4 | 176 | 1166.67 | 41.73 | 0.04 | ||
| 83 | 2 | Endless Sunset | 3-3 | 1205.82 | 21 | 1210.52 | -4.7 | 0 | ||
| 84 | 2 | Dreadnought | 13-6 | 1203.2 | 16 | South Central | Ozarks | 1029.6 | 173.6 | 0.17 |
| 85 | 1 | Green River Swordfish | 8-11 | 1197.07 | 32 | Southwest | NorCal | 1197.55 | -0.49 | 0 |
| 86 | 1 | Harvey Cats | 14-6 | 1188.18 | 15 | South Central | Texas | 1026.66 | 161.52 | 0.16 |
| 87 | 1 | BARNSTORM | 10-9 | 1184.86 | 17 | South Central | Ozarks | 1198.88 | -14.02 | -0.01 |
| 88 | 1 | Triumph | 14-6 | 1184.1 | 15 | Southeast | North Carolina | 1033.68 | 150.42 | 0.15 |
| 89 | 8 | Make it Rain | 9-10 | 1181.15 | 80 | Northwest | Washington/BC | 1255.22 | -74.07 | -0.06 |
| 90 | 1 | Ascension | 5-7 | 1178.59 | 17 | Northeast | West New England | 1281.75 | -103.16 | -0.08 |
| 91 | 1 | Bux | 10-8 | 1176.78 | 21 | North Central | Northwest Plains | 1185.31 | -8.53 | -0.01 |
| - | Utah Swarm U20 Boys | 1-1 | 1173.59 | 20 | 957.33 | 216.27 | 0.23 | |||
| 92 | Battleship | 11-2 | 1159.8 | 21 | Southeast | Gulf Coast | 893.19 | 266.61 | 0.3 | |
| 93 | PIPE | 3-4 | 1154.95 | 18 | 1147.47 | 7.48 | 0.01 | |||
| 94 | Magma Bears | 12-6 | 1151.26 | 14 | Northeast | Metro NY | 1001.82 | 149.44 | 0.15 | |
| 95 | Red Lotus | 7-4 | 1145.92 | 17 | South Central | Rocky Mountain | 1001.21 | 144.71 | 0.14 | |
| 96 | 1 | Black Lung | 11-8 | 1128.6 | 15 | Great Lakes | East Plains | 1071.05 | 57.55 | 0.05 |
| 97 | 1 | DeMo | 14-11 | 1119.98 | 18 | North Central | West Plains | 1063.77 | 56.2 | 0.05 |
| 98 | 2 | John Doe | 11-7 | 1118.5 | 13 | Mid-Atlantic | Capital | 1032.77 | 85.73 | 0.08 |
| 99 | BAG | 6-6 | 1115.07 | 19 | Northeast | East New England | 1064.47 | 50.6 | 0.05 | |
| 100 | 1 | Drought | 14-8 | 1104.41 | 23 | Southwest | So Cal | 1084.1 | 20.3 | 0.02 |
| 101 | 1 | NOMAD | 16-9 | 1100.24 | 19 | North Central | Northwest Plains | 948.99 | 151.25 | 0.16 |
| 102 | 1 | Sprawl | 9-5 | 1095.75 | 16 | South Central | Texas | 936.84 | 158.91 | 0.17 |
| 103 | 1 | Carolina Summer | 8-6 | 1092.18 | 18 | Southeast | East Coast | 1153.27 | -61.09 | -0.05 |
| 104 | 1 | Second Nature | 9-4 | 1086.27 | 21 | Southeast | Gulf Coast | 945.34 | 140.94 | 0.15 |
| 105 | 1 | HouSE | 9-9 | 1083.52 | 18 | North Central | Northwest Plains | 1077.15 | 6.38 | 0.01 |
| 106 | 1 | Scythe | 7-6 | 1072.74 | 19 | North Central | West Plains | 934.28 | 138.47 | 0.15 |
| 107 | 1 | Hooch | 11-2 | 1063.35 | 24 | Southeast | East Coast | 731.7 | 331.66 | 0.45 |
| 108 | 2 | DINGWOP | 6-6 | 1059.61 | 18 | North Central | Northwest Plains | 1158.44 | -98.84 | -0.09 |
| 109 | Sundance Kids | 8-3 | 1057.73 | 21 | 1066.54 | -8.81 | -0.01 | |||
| 110 | 6 | Skeleton Squad | 15-10 | 1045.76 | 2 | Northeast | East New England | 932.55 | 113.22 | 0.12 |
| 111 | 2 | Crypt | 11-7 | 1040.53 | 10 | Mid-Atlantic | Capital | 942.33 | 98.2 | 0.1 |
| 112 | 1 | Touch of Grey | 4-2 | 1039.67 | 18 | 949.14 | 90.53 | 0.1 | ||
| 113 | 1 | Nighthawk | 9-7 | 1034.34 | 21 | Southwest | So Cal | 1024.77 | 9.58 | 0.01 |
| 114 | 1 | NOx | 8-10 | 1029.43 | 16 | North Central | West Plains | 1119.49 | -90.06 | -0.08 |
| 115 | 1 | OC Crows | 7-5 | 1026.48 | 19 | Southwest | So Cal | 962.54 | 63.94 | 0.07 |
| 116 | 2 | STL Moonar | 7-7 | 1017.64 | 17 | North Central | West Plains | 1049.99 | -32.35 | -0.03 |
| 117 | 2 | Rawhide | 12-7 | 1015.37 | 17 | South Central | Ozarks | 981.36 | 34.01 | 0.03 |
| - | Impulse | 1-1 | 1014.32 | 16 | 1026.65 | -12.33 | -0.01 | |||
| 118 | 1 | Atlanta Arson | 9-4 | 1012.84 | 29 | Southeast | East Coast | 777.24 | 235.61 | 0.3 |
| 119 | 1 | Trident II | 3-4 | 1008.15 | 21 | Great Lakes | Central Plains | 1106.73 | -98.58 | -0.09 |
| 120 | 24 | Heartbreak | 5-8 | 985.17 | 170 | 1113.91 | -128.74 | -0.12 | ||
| 121 | 2 | Colorado Cutthroat U-20 Boys | 4-4 | 976.4 | 15 | 1007.68 | -31.29 | -0.03 | ||
| 122 | OPE | 9-9 | 972.11 | 20 | North Central | Northwest Plains | 940.89 | 31.22 | 0.03 | |
| 123 | 20 | Seven Gills | 5-14 | 964.02 | 67 | Northwest | Washington/BC | 1203.4 | -239.37 | -0.2 |
| 124 | 3 | Helots | 7-12 | 963.79 | 41 | Mid-Atlantic | Founders | 1155.06 | -191.28 | -0.17 |
| 125 | COSmic U-20 Boys | 3-2 | 956.88 | 13 | 920.34 | 36.54 | 0.04 | |||
| 126 | 2 | Capitol City Chaos | 3-3 | 950.34 | 20 | Southeast | Gulf Coast | 1036.89 | -86.55 | -0.08 |
| 127 | Rumspringa | 3-3 | 945.32 | 13 | 939.54 | 5.78 | 0.01 | |||
| 128 | 2 | Villains | 2-4 | 944.34 | 20 | 965.44 | -21.1 | -0.02 | ||
| 129 | 2 | CITYWIDE Special | 5-7 | 940.64 | 9 | Mid-Atlantic | Founders | 889.8 | 50.85 | 0.06 |
| 130 | 2 | Riptide | 12-8 | 940.58 | 15 | South Central | Texas | 874.93 | 65.65 | 0.08 |
| 131 | 2 | Roundhouse | 5-8 | 934.89 | 21 | Great Lakes | Central Plains | 1103.15 | -168.25 | -0.15 |
| 132 | Texas United | 3-4 | 931.83 | 15 | 1021.56 | -89.74 | -0.09 | |||
| 133 | 3 | Minnesota Superior U20B | 3-3 | 929.64 | 23 | 868.29 | 61.34 | 0.07 | ||
| 134 | Surf | 2-4 | 923.88 | 10 | 1121.1 | -197.22 | -0.18 | |||
| 135 | 2 | Bomb Squad | 10-6 | 921.69 | 14 | Mid-Atlantic | Capital | 843.79 | 77.9 | 0.09 |
| 136 | 1 | Charleston Heat Stroke | 11-10 | 916.81 | 16 | Southeast | East Coast | 948.09 | -31.29 | -0.03 |
| 137 | Cowtown Cannons | 10-10 | 913.8 | 15 | South Central | Texas | 963.82 | -50.02 | -0.05 | |
| 138 | 2 | Cookie Mon$terz | 9-10 | 911.92 | 19 | Southeast | Gulf Coast | 964.97 | -53.05 | -0.05 |
| 139 | 1 | Alliance 2 | 6-7 | 905.03 | 21 | Southeast | Gulf Coast | 927.02 | -21.98 | -0.02 |
| 140 | 1 | Pittsburgh Stealers | 7-5 | 904.43 | 11 | Mid-Atlantic | Founders | 904.47 | -0.05 | 0 |
| 141 | 1 | Scoop | 6-7 | 901.06 | 11 | Great Lakes | East Plains | 964.38 | -63.32 | -0.07 |
| 142 | Nomads | 7-12 | 891.39 | 15 | North Central | Northwest Plains | 913.56 | -22.18 | -0.02 | |
| 143 | 1 | Timber | 7-12 | 871.45 | 19 | North Central | Northwest Plains | 999.1 | -127.65 | -0.13 |
| 144 | 1 | El Niño | 7-5 | 869.05 | 17 | Southeast | Florida | 769.2 | 99.84 | 0.13 |
| 145 | 1 | Carbon | 7-10 | 868.93 | 16 | South Central | Rocky Mountain | 1072.36 | -203.43 | -0.19 |
| 146 | AVE | 0-6 | 867.72 | 1202.16 | -334.44 | -0.28 | ||||
| 147 | Void | 9-10 | 865.44 | 15 | North Central | Northwest Plains | 953.39 | -87.95 | -0.09 | |
| 148 | 7 | Oregon Trainwreck | 2-4 | 863.67 | 47 | 965.09 | -101.42 | -0.11 | ||
| 149 | Alibi | 12-13 | 860.11 | 15 | Northeast | Upstate NY | 904.44 | -44.34 | -0.05 | |
| 150 | 2 | PowderHogs | 6-4 | 856.92 | 20 | Northwest | Big Sky | 961.96 | -105.03 | -0.11 |
| 151 | 1 | Odyssey | 12-13 | 855.74 | 16 | Northeast | East New England | 951.9 | -96.17 | -0.1 |
| 152 | 1 | Hazard | 7-5 | 852.88 | 8 | Mid-Atlantic | Founders | 852 | 0.88 | 0 |
| 153 | 2 | Enigma | 7-5 | 852.33 | 14 | Great Lakes | East Plains | 718.3 | 134.03 | 0.19 |
| 154 | 2 | Nocturnal | 5-8 | 841.91 | 20 | Southeast | East Coast | 955.69 | -113.78 | -0.12 |
| 155 | 1 | MOB Ultimate | 9-12 | 839.34 | 14 | Mid-Atlantic | Capital | 879.21 | -39.88 | -0.05 |
| 156 | 1 | Ronin | 3-4 | 814.52 | 22 | 855.12 | -40.6 | -0.05 | ||
| 157 | The Incline | 1-3 | 812.73 | 17 | 1079.51 | -266.78 | -0.25 | |||
| 158 | 2 | Expendables | 2-4 | 811.58 | 18 | 963.07 | -151.49 | -0.16 | ||
| 159 | 1 | SUPA FC | 5-5 | 801.45 | 8 | Mid-Atlantic | Founders | 934.9 | -133.45 | -0.14 |
| 160 | 2 | NC Brickhouse-Upper | 8-10 | 796.82 | 14 | Southeast | North Carolina | 779.36 | 17.46 | 0.02 |
| 161 | Firefly TX | 9-11 | 789.09 | 14 | South Central | Texas | 904.37 | -115.28 | -0.13 | |
| 162 | Winc City Fog | 6-9 | 787.52 | 9 | Mid-Atlantic | Capital | 916.47 | -128.95 | -0.14 | |
| 163 | 4 | Offshore | 2-5 | 785.32 | 25 | 862.38 | -77.05 | -0.09 | ||
| 164 | Fat Stacks | 4-8 | 777.79 | 17 | Northwest | Big Sky | 802.84 | -25.05 | -0.03 | |
| 165 | 2 | Bloom | 11-8 | 775.44 | 20 | Southeast | Florida | 643.02 | 132.42 | 0.21 |
| 166 | 1 | Forge | 3-11 | 765.03 | 16 | South Central | Texas | 1027.9 | -262.87 | -0.26 |
| 167 | Battery | 6-12 | 750.69 | 18 | Southwest | NorCal | 915.69 | -165 | -0.18 | |
| 168 | Psychedelic | 7-6 | 746.41 | 12 | Southeast | Florida | 829.25 | -82.85 | -0.1 | |
| 169 | 3 | Bartle Boys | 3-2 | 742.69 | 30 | 601.92 | 140.77 | 0.23 | ||
| 170 | Friendly Fire | 3-10 | 738.01 | 17 | North Central | West Plains | 1023.07 | -285.06 | -0.28 | |
| 171 | 2 | Bay Dog | 1-2 | 736.79 | 18 | 845.2 | -108.41 | -0.13 | ||
| 172 | 1 | STL Goonar | 1-6 | 728.75 | 17 | 1098.23 | -369.48 | -0.34 | ||
| 173 | 2 | Jolly Roger | 3-3 | 716.01 | 3 | 751.08 | -35.07 | -0.05 | ||
| 174 | 9 | Hydra | 6-4 | 715.14 | 51 | 500.96 | 214.17 | 0.43 | ||
| 175 | 1 | Sonoran Dog | 4-8 | 713.67 | 6 | Southwest | So Cal | 703.79 | 9.88 | 0.01 |
| 176 | 3 | DAPPER | 6-7 | 706.73 | 14 | Northeast | Upstate NY | 734.27 | -27.54 | -0.04 |
| 177 | 5 | BANG | 4-2 | 703.16 | 19 | 510.24 | 192.92 | 0.38 | ||
| 178 | 1 | Choice City Hops | 5-14 | 692.04 | 18 | South Central | Rocky Mountain | 859.88 | -167.84 | -0.2 |
| 179 | 3 | UpRoar | 4-8 | 690.77 | 20 | Southeast | Florida | 793.13 | -102.36 | -0.13 |
| 180 | 2 | Mystik Dan | 2-4 | 681.6 | 27 | 700.23 | -18.62 | -0.03 | ||
| 181 | 1 | Diesel | 7-12 | 678.21 | 14 | Great Lakes | East Plains | 788.45 | -110.24 | -0.14 |
| 182 | 3 | Dallas Delinquents | 7-12 | 676.7 | 15 | South Central | Texas | 721.88 | -45.18 | -0.06 |
| 183 | 2 | Amigos [JV] | 2-4 | 661.22 | 15 | 885.76 | -224.54 | -0.25 | ||
| 184 | 2 | Space Cowboys | 6-7 | 655.54 | 19 | Southeast | East Coast | 733.82 | -78.28 | -0.11 |
| 185 | 1 | Green Mountain Boys | 6-5 | 644.15 | 20 | Northeast | East New England | 647.21 | -3.06 | 0 |
| 186 | 1 | San Antonio Warhawks | 6-14 | 626.99 | 15 | South Central | Texas | 768.68 | -141.68 | -0.18 |
| 187 | 2 | Rubicon Rapids | 3-14 | 602.47 | 12 | North Central | Northwest Plains | 889.82 | -287.35 | -0.32 |
| 188 | 2 | Queen City Kings | 6-14 | 599.49 | 19 | Southeast | North Carolina | 773.63 | -174.14 | -0.23 |
| - | Cache Valley Chaos | 0-2 | 590.87 | 20 | 960.23 | -369.36 | -0.38 | |||
| 189 | 2 | Rebels | 2-4 | 576.87 | 18 | 735.34 | -158.47 | -0.22 | ||
| 190 | 1 | BDC | 6-12 | 575.27 | 9 | Mid-Atlantic | Capital | 712.63 | -137.36 | -0.19 |
| 191 | 1 | Watchmen | 3-10 | 567.08 | 21 | Southeast | East Coast | 837.12 | -270.04 | -0.32 |
| 192 | 4 | DCVIII | 3-15 | 548.94 | 43 | North Central | Northwest Plains | 859.82 | -310.88 | -0.36 |
| 193 | 1 | On Ramp | 4-8 | 545.3 | 15 | Great Lakes | Central Plains | 658.31 | -113.01 | -0.17 |
| 194 | 1 | Minnesota Superior U17B | 1-6 | 536.87 | 20 | 891.96 | -355.09 | -0.4 | ||
| 195 | EZ | 2-8 | 516.09 | 5 | Mid-Atlantic | Founders | 635.83 | -119.74 | -0.19 | |
| 196 | 2 | Dyno | 6-6 | 497.19 | 30 | Southeast | East Coast | 376.5 | 120.69 | 0.32 |
| 197 | Mischief | 6-18 | 495.93 | 15 | Great Lakes | East Plains | 743.06 | -247.13 | -0.33 | |
| 198 | 2 | MBTA | 3-9 | 489.27 | 27 | Northeast | East New England | 682.53 | -193.26 | -0.28 |
| 199 | Golden Triangle Ultimate | 3-15 | 486.46 | 19 | Southeast | Gulf Coast | 774.37 | -287.91 | -0.37 | |
| 200 | 2 | Sonoran Pups | 2-8 | 482.71 | 25 | Southwest | So Cal | 832.79 | -350.09 | -0.42 |
| - | Titans | 1-1 | 469.62 | 514.63 | -45.02 | -0.09 | ||||
| 201 | 1 | Harvest Moon | 6-6 | 469.42 | 34 | Southeast | East Coast | 477.31 | -7.89 | -0.02 |
| - | Flying Pig | 0-2 | 466.47 | 14 | 1045.24 | -578.77 | -0.55 | |||
| 202 | 1 | Resurgam | 1-5 | 463.6 | 20 | 845.57 | -381.96 | -0.45 | ||
| 203 | Riverside Messengers | 2-17 | 432.98 | 15 | South Central | Texas | 724.4 | -291.43 | -0.4 | |
| 204 | 2 | Crossfire | 5-13 | 431.04 | 34 | Northeast | East New England | 516.42 | -85.38 | -0.17 |
| 205 | 3 | Beef Depot | 7-14 | 411.89 | 18 | Mid-Atlantic | Capital | 574.73 | -162.83 | -0.28 |
| 206 | 2 | Buffalo Frostbite | 8-12 | 396.78 | 37 | Northeast | Upstate NY | 423.82 | -27.04 | -0.06 |
| 207 | Gambit | 3-10 | 381.33 | 13 | Southeast | North Carolina | 551.27 | -169.94 | -0.31 | |
| 208 | 2 | Metro | 1-6 | 381.31 | 16 | 732.16 | -350.85 | -0.48 | ||
| 209 | 4 | ONI | 0-6 | 353.36 | 52 | 918.19 | -564.84 | -0.62 | ||
| 210 | 1 | Loaded Panda | 0-13 | 335.25 | 21 | North Central | West Plains | 771.38 | -436.14 | -0.57 |
| 211 | 2 | Monsoon | 1-11 | 328.31 | 48 | Southwest | So Cal | 707.02 | -378.71 | -0.54 |
| 212 | 2 | PARLAY | 3-19 | 319.47 | 50 | Southeast | North Carolina | 610.25 | -290.78 | -0.48 |
| 213 | 1 | TYDL | 0-5 | 289.22 | 16 | 889.22 | -600 | -0.67 | ||
| 214 | 1 | Frizz | 2-4 | 265.32 | 18 | 405.79 | -140.48 | -0.35 | ||
| 215 | 1 | Long Island Riff Raff | 2-10 | 265.13 | 2 | Northeast | Metro NY | 532.67 | -267.54 | -0.5 |
| 216 | 1 | Tennessee Folklore | 2-11 | 250.99 | 10 | Southeast | East Coast | 549.4 | -298.41 | -0.54 |
| 217 | 1 | Anchor | 0-9 | 212.84 | 18 | Southwest | NorCal | 739.95 | -527.11 | -0.71 |
| 218 | 1 | Shenanigans | 1-11 | 211.69 | 15 | Great Lakes | Central Plains | 575.22 | -363.53 | -0.63 |
| 219 | 1 | Oakay | 1-17 | 209.14 | 8 | Southeast | North Carolina | 635.51 | -426.38 | -0.67 |
| 220 | 1 | Adventure Time | 1-5 | 178.74 | 15 | 499.44 | -320.7 | -0.64 | ||
| 221 | Spring Break '93 | 2-10 | 161.32 | 46 | Northeast | Metro NY | 374.68 | -213.36 | -0.57 | |
| 222 | 2 | Bud | 1-5 | 124.05 | 19 | 333.58 | -209.53 | -0.63 | ||
| 223 | Atlanta Outlaws | 2-4 | 50.18 | 33 | 217.05 | -166.88 | -0.77 | |||
| 224 | Supercell | 1-12 | 47.56 | 17 | South Central | Ozarks | 355.01 | -307.45 | -0.87 | |
| 225 | 3 | Motive | 2-14 | 8.16 | 82 | Northeast | Upstate NY | 460.73 | -452.57 | -0.98 |
| 226 | Virginia Vortex | 0-4 | -57.81 | 5 | 516.09 | -573.9 | -1.11 | |||
| 227 | 2 | Power Point Ultimate | 1-11 | -72.61 | 31 | Southeast | East Coast | 312.75 | -385.36 | -1.23 |
| 228 | 1 | Mohawk Valley Wild | 1-5 | -89.04 | 161 | Northeast | Upstate NY | 169.29 | -258.33 | -1.53 |
| 229 | 2 | Chemical X | 1-7 | -161.17 | 88 | 103.51 | -264.68 | -2.56 | ||
| 230 | 2 | Deadwood | 0-6 | -242.27 | 18 | 267.01 | -509.28 | -1.91 | ||
| 231 | 1 | ATL B | 0-6 | -305.93 | 38 | 99.01 | -404.94 | -4.09 | ||
| 232 | 1 | Players Into Serious Sports | 0-6 | -397.21 | 19 | 190.51 | -587.72 | -3.08 | ||
| 233 | 1 | Buffalo Practice Players | 0-3 | -761.17 | 88 | -161.17 | -600 | 3.72 | ||
| 234 | 1 | Moon Pigs | 0-3 | NaN | NaN | NaN | ||||
| 235 | 1 | Flying Piglet | 0-3 | NaN | NaN | NaN | ||||
| - | Powerpuffs | 0-1 | NaN | NaN | NaN | |||||
| - | Dutch Ovens | 0-2 | NaN | NaN | NaN | |||||
| - | Utah Swarm U20 Mixed | 0-1 | NaN | NaN | NaN | |||||
| - | Utah Swarm U17 Boys | 0-1 | NaN | NaN | NaN |
FAQ
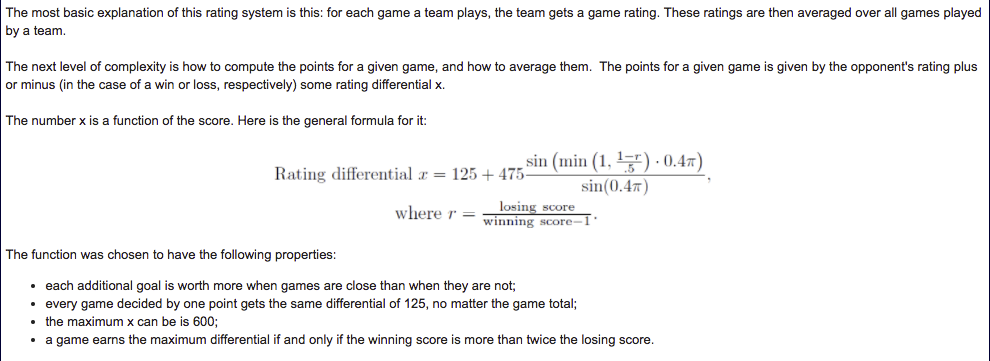
The results on this page ("USAU") are the results of an implementation of the USA Ultimate Top 20 algorithm, which is used to allocate post season bids to both colleg and club ultimate teams. The data was obtained by scraping USAU's score reporting website. Learn more about the algorithm here. TL;DR, here is the rating function. Every game a team plays gets a rating equal to the opponents rating +/- the score value. With all these data points, we iterate team ratings until convergence. There is also a rule for discounting blowout games (see next FAQ)
For reference, here is handy table with frequent game scrores and the resulting game value: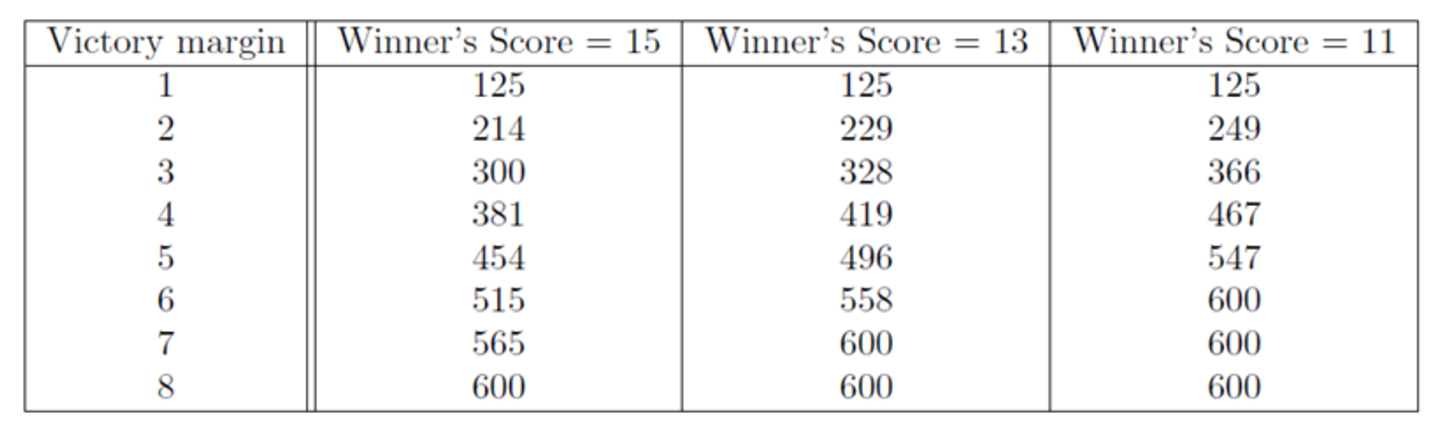
For reference, here is handy table with frequent game scrores and the resulting game value:
"...if a team is rated more than 600 points higher than its opponent, and wins with a score that is more than twice the losing score plus one, the game is ignored for ratings purposes. However, this is only done if the winning team has at least N other results that are not being ignored, where N=5."
Translation: if a team plays a game where even earning the max point win would hurt them, they can have the game ignored provided they win by enough and have suffficient unignored results.
Translation: if a team plays a game where even earning the max point win would hurt them, they can have the game ignored provided they win by enough and have suffficient unignored results.