College Men's USAU Rankings
2024-25 Season
Data updated through May 4 at 8:45pm EDT (some scores likely missing)
AC 1 · GL 1 · ME 1 · NE 3 · NC 1 · NW 5 · OV 1 · SC 3 · SE 1 · SW 3
| Rank | Change | Team | Record | Rating | Change | Region | Conference | Div | SoS | PDC | % |
|---|---|---|---|---|---|---|---|---|---|---|---|
| 1 | 1 | Oregon NW 1 | 33-4 | 2374.43 | 11 | Northwest | Cascadia DI | D-I | 2083.85 | 290.59 | 0.14 |
| 2 | 1 | Massachusetts NE 1 | 26-4 | 2369.51 | 47 | New England | Greater New England DI | D-I | 2017.58 | 351.94 | 0.17 |
| 3 | 1 | North Carolina AC 1 | 33-3 | 2338.86 | 21 | Atlantic Coast | Carolina DI | D-I | 1962.3 | 376.57 | 0.19 |
| 4 | 1 | Colorado SC 1 | 25-4 | 2337.87 | 21 | South Central | Rocky Mountain DI | D-I | 2035.02 | 302.87 | 0.15 |
| 5 | 2 | Carleton College NC 1 | 27-3 | 2337.82 | 27 | North Central | Northwoods DI | D-I | 2028.92 | 308.91 | 0.15 |
| 6 | Cal Poly-SLO SW 1 | 33-6 | 2236.91 | 31 | Southwest | SoCal DI | D-I | 1941.81 | 295.11 | 0.15 | |
| 7 | Brigham Young NW 2 | 21-2 | 2212.51 | 34 | Northwest | Big Sky DI | D-I | 1857.99 | 354.52 | 0.19 | |
| 8 | 1 | California-Santa Cruz SW 2 | 27-9 | 2150.25 | 35 | Southwest | NorCal DI | D-I | 1896.02 | 254.25 | 0.13 |
| 9 | 2 | Oregon State NW 3 | 26-13 | 2116.46 | 19 | Northwest | Cascadia DI | D-I | 2024.04 | 92.44 | 0.05 |
| 10 | 2 | Washington NW 4 | 20-12 | 2107.1 | 109 | Northwest | Cascadia DI | D-I | 2036.73 | 70.38 | 0.03 |
| 11 | 1 | Washington University SC 2 | 22-6 | 2082.57 | 22 | South Central | Ozarks DI | D-I | 1756.88 | 325.7 | 0.19 |
| 12 | 1 | California SW 3 | 28-14 | 2077.75 | 26 | Southwest | NorCal DI | D-I | 1953.89 | 123.88 | 0.06 |
| 13 | 3 | Northeastern NE 2 | 18-14 | 2060.98 | 4 | New England | Metro Boston DI | D-I | 2027.89 | 33.09 | 0.02 |
| 14 | Texas SC 3 | 24-8 | 2042.23 | 23 | South Central | South Texas DI | D-I | 1807.42 | 234.83 | 0.13 | |
| 15 | Davenport | 25-1 | 2041.09 | 19 | Great Lakes | Great Lakes DIII | D-III | 1530.89 | 510.2 | 0.33 | |
| 16 | 6 | British Columbia NW 5 | 20-9 | 2030.23 | 122 | Northwest | Cascadia DI | D-I | 2004.86 | 25.38 | 0.01 |
| 17 | 1 | Georgia SE 1 | 22-10 | 2014.6 | 24 | Southeast | Southern Appalachian DI | D-I | 1832.1 | 182.51 | 0.1 |
| 18 | 1 | Brown NE 3 | 22-12 | 2012.59 | 43 | New England | Greater New England DI | D-I | 1948.85 | 63.75 | 0.03 |
| 19 | 1 | Vermont | 15-17 | 1998.44 | 30 | New England | Greater New England DI | D-I | 1982.18 | 16.27 | 0.01 |
| 20 | 1 | Tufts | 19-10 | 1995.17 | 35 | New England | Metro Boston DI | D-I | 1890.09 | 105.09 | 0.06 |
| 21 | Georgia Tech | 22-10 | 1976.19 | 22 | Southeast | Southern Appalachian DI | D-I | 1881.69 | 94.51 | 0.05 | |
| 22 | Penn State OV 1 | 18-12 | 1972.46 | 20 | Ohio Valley | West Penn DI | D-I | 1870.64 | 101.85 | 0.05 | |
| 23 | Western Washington | 18-13 | 1970.42 | 18 | Northwest | Cascadia DI | D-I | 1897.97 | 72.46 | 0.04 | |
| 24 | 1 | Victoria | 18-14 | 1950.02 | 9 | Northwest | Cascadia DI | D-I | 1841.76 | 108.26 | 0.06 |
| 25 | 1 | Utah Valley | 13-8 | 1944 | 25 | Northwest | Big Sky DI | D-I | 1805.07 | 138.94 | 0.08 |
| 26 | Michigan GL 1 | 17-6 | 1903.48 | 24 | Great Lakes | Michigan DI | D-I | 1783.41 | 120.08 | 0.07 | |
| 27 | 7 | Utah | 18-13 | 1903.46 | 63 | Northwest | Big Sky DI | D-I | 1886.65 | 16.83 | 0.01 |
| 28 | 1 | Minnesota | 14-16 | 1867.14 | 25 | North Central | Northwoods DI | D-I | 1900.3 | -33.14 | -0.02 |
| 29 | 1 | Virginia | 20-10 | 1861.99 | 20 | Atlantic Coast | Virginia DI | D-I | 1768.36 | 93.64 | 0.05 |
| 30 | 1 | Pittsburgh | 15-16 | 1856.29 | 23 | Ohio Valley | West Penn DI | D-I | 1870.36 | -14.03 | -0.01 |
| 31 | 1 | Ottawa ME 1 | 17-1 | 1854.8 | 18 | Metro East | Western NY DI | D-I | 1438.69 | 416.12 | 0.29 |
| 32 | 1 | California-Santa Barbara | 19-21 | 1836.17 | 26 | Southwest | SoCal DI | D-I | 1838.32 | -2.14 | 0 |
| 33 | Elon | 24-5 | 1825.66 | 17 | Atlantic Coast | Atlantic Coast DIII | D-III | 1516.53 | 309.14 | 0.2 | |
| 34 | 1 | South Carolina | 22-7 | 1815.3 | 19 | Atlantic Coast | Carolina DI | D-I | 1686.62 | 128.69 | 0.08 |
| 35 | 3 | Ave Maria | 19-1 | 1797.22 | 19 | Southeast | Southeast DIII | D-I | 1476.63 | 320.6 | 0.22 |
| 36 | 4 | Lewis & Clark | 20-3 | 1797.06 | 11 | Northwest | Northwest DIII | D-III | 1446.24 | 350.83 | 0.24 |
| 37 | 2 | Cincinnati | 21-3 | 1796.25 | 15 | Ohio Valley | Ohio DI | D-I | 1491.01 | 305.25 | 0.2 |
| 38 | 6 | Utah State | 10-13 | 1793.87 | 58 | Northwest | Big Sky DI | D-I | 1868.28 | -74.39 | -0.04 |
| 39 | 2 | McGill | 14-13 | 1778.63 | 40 | New England | Greater New England DI | D-I | 1701.37 | 77.27 | 0.05 |
| 40 | 4 | Middlebury | 21-5 | 1774.28 | 45 | New England | North New England DIII | D-III | 1480.83 | 293.46 | 0.2 |
| 41 | California-San Diego | 15-22 | 1772.27 | 20 | Southwest | SoCal DI | D-I | 1809.48 | -37.2 | -0.02 | |
| 42 | Colorado State | 11-16 | 1766.65 | 18 | South Central | Rocky Mountain DI | D-I | 1864.91 | -98.25 | -0.05 | |
| 43 | Whitman | 11-4 | 1764.88 | 19 | Northwest | Northwest DIII | D-III | 1544.29 | 220.6 | 0.14 | |
| 44 | Wisconsin | 21-12 | 1754.2 | 23 | North Central | Lake Superior DI | D-I | 1661.92 | 92.29 | 0.06 | |
| 45 | Virginia Tech | 21-12 | 1752.57 | 23 | Atlantic Coast | Virginia DI | D-I | 1651.63 | 100.96 | 0.06 | |
| 46 | Stanford | 23-21 | 1741.55 | 24 | Southwest | NorCal DI | D-I | 1739.73 | 1.83 | 0 | |
| 47 | Emory | 18-16 | 1735.48 | 21 | Southeast | Southern Appalachian DI | D-I | 1671.33 | 64.16 | 0.04 | |
| 48 | North Carolina-Wilmington | 19-16 | 1731.26 | 21 | Atlantic Coast | Carolina DI | D-I | 1705.69 | 25.58 | 0.01 | |
| 49 | Chicago | 19-10 | 1729.32 | 19 | Great Lakes | Illinois DI | D-I | 1652.6 | 76.75 | 0.05 | |
| 50 | Tulane | 14-11 | 1708.09 | 21 | Southeast | Gulf Coast DI | D-I | 1649.81 | 58.28 | 0.04 | |
| 51 | Cornell | 25-8 | 1706.16 | 18 | Metro East | Western NY DI | D-I | 1475.32 | 230.85 | 0.16 | |
| 52 | 1 | William & Mary | 24-13 | 1693.54 | 17 | Atlantic Coast | Virginia DI | D-I | 1584.01 | 109.55 | 0.07 |
| 53 | 1 | Purdue | 18-13 | 1692.88 | 21 | Great Lakes | East Plains DI | D-I | 1526.56 | 166.34 | 0.11 |
| 54 | UCLA | 15-19 | 1683.5 | 21 | Southwest | SoCal DI | D-I | 1768.38 | -84.87 | -0.05 | |
| 55 | Maryland | 22-7 | 1677.37 | 18 | Atlantic Coast | Colonial DI | D-I | 1521.79 | 155.6 | 0.1 | |
| 56 | Indiana | 20-9 | 1659.35 | 20 | Great Lakes | East Plains DI | D-I | 1560.37 | 98.98 | 0.06 | |
| 57 | Oklahoma Christian | 19-7 | 1656.39 | 17 | South Central | Ozarks DIII | D-III | 1498.9 | 157.49 | 0.11 | |
| 58 | 1 | James Madison | 20-18 | 1650.67 | 19 | Atlantic Coast | Virginia DI | D-I | 1631.82 | 18.87 | 0.01 |
| 59 | 1 | Illinois | 22-9 | 1650.19 | 23 | Great Lakes | Illinois DI | D-I | 1493.1 | 157.11 | 0.11 |
| 60 | Carleton College-CHOP | 23-5 | 1646.37 | 16 | North Central | Northwoods DIII | D-III | 1359.42 | 286.96 | 0.21 | |
| 61 | Michigan State | 22-8 | 1636.07 | 23 | Great Lakes | Michigan DI | D-I | 1482.77 | 153.3 | 0.1 | |
| 62 | North Carolina State | 17-18 | 1633.63 | 18 | Atlantic Coast | Carolina DI | D-I | 1682.69 | -49.05 | -0.03 | |
| 63 | Duke | 20-12 | 1632.68 | 16 | Atlantic Coast | Carolina DI | D-I | 1536.33 | 96.36 | 0.06 | |
| 64 | Georgetown | 16-15 | 1628.4 | 17 | Atlantic Coast | Colonial DI | D-I | 1544.4 | 84.01 | 0.05 | |
| 65 | Grand Canyon | 15-5 | 1624.33 | 21 | Southwest | Desert DI | D-I | 1479.8 | 144.55 | 0.1 | |
| 66 | 1 | Franciscan | 19-4 | 1623.97 | 14 | Ohio Valley | Ohio DIII | D-III | 1311.86 | 312.12 | 0.24 |
| 67 | 1 | Auburn | 15-13 | 1621.8 | 19 | Southeast | Gulf Coast DI | D-I | 1526.64 | 95.21 | 0.06 |
| 68 | Alabama-Huntsville | 13-12 | 1610.26 | 20 | Southeast | Gulf Coast DI | D-I | 1513.44 | 96.83 | 0.06 | |
| 69 | North Carolina-Charlotte | 13-17 | 1604.44 | 15 | Atlantic Coast | Carolina DI | D-I | 1542.91 | 61.54 | 0.04 | |
| 70 | Dartmouth | 16-14 | 1595.96 | 23 | New England | North New England DIII | D-I | 1517.78 | 78.19 | 0.05 | |
| 71 | Florida | 12-11 | 1590.96 | 19 | Southeast | Florida DI | D-I | 1537.02 | 53.96 | 0.04 | |
| 72 | St Olaf | 26-9 | 1589.88 | 17 | North Central | Northwoods DIII | D-III | 1348.1 | 241.79 | 0.18 | |
| 73 | 2 | Wesleyan | 16-6 | 1587.29 | 12 | Metro East | Hudson Valley DIII | D-III | 1296.44 | 290.88 | 0.22 |
| 74 | Temple | 18-14 | 1584.07 | 16 | Ohio Valley | East Penn DI | D-I | 1455.53 | 128.56 | 0.09 | |
| 75 | 2 | Iowa State | 23-8 | 1582.5 | 19 | North Central | West Plains DI | D-I | 1379.43 | 203.1 | 0.15 |
| 76 | 1 | Ohio State | 17-17 | 1570.01 | 18 | Ohio Valley | Ohio DI | D-I | 1571.22 | -1.21 | 0 |
| 77 | 1 | Richmond | 16-11 | 1564.2 | 18 | Atlantic Coast | Atlantic Coast DIII | D-III | 1450.24 | 113.98 | 0.08 |
| 78 | 1 | Notre Dame | 15-14 | 1554.57 | 17 | Great Lakes | East Plains DI | D-I | 1506.36 | 48.24 | 0.03 |
| 79 | 1 | Case Western Reserve | 20-10 | 1545.72 | 17 | Ohio Valley | Ohio DI | D-I | 1416 | 129.76 | 0.09 |
| 80 | 4 | Williams | 19-9 | 1539.38 | 53 | New England | South New England DIII | D-III | 1410.83 | 128.57 | 0.09 |
| 81 | Rochester | 16-5 | 1538.5 | 17 | Metro East | Western NY DIII | D-III | 1336.8 | 201.72 | 0.15 | |
| 82 | Tennessee | 12-13 | 1525.87 | 20 | Southeast | Southern Appalachian DI | D-I | 1535.57 | -9.7 | -0.01 | |
| 83 | Simon Fraser | 6-4 | 1518.65 | 24 | Northwest | Cascadia DI | D-I | 1440.35 | 78.31 | 0.05 | |
| 84 | 1 | Boston College | 14-11 | 1507.56 | 9 | New England | Metro Boston DI | D-I | 1383.62 | 123.95 | 0.09 |
| 85 | 1 | Southern California | 20-13 | 1499.33 | 20 | Southwest | SoCal DI | D-I | 1398.48 | 100.87 | 0.07 |
| 86 | Colorado-B | 19-6 | 1493.4 | 16 | South Central | Rocky Mountain DI | Dev | 1332.16 | 161.26 | 0.12 | |
| 87 | Missouri S&T | 23-8 | 1491.08 | 16 | South Central | Ozarks DIII | D-III | 1315.16 | 175.93 | 0.13 | |
| 88 | Carnegie Mellon | 16-13 | 1489.55 | 17 | Ohio Valley | West Penn DI | D-I | 1484.15 | 5.24 | 0 | |
| 89 | Colorado College | 18-8 | 1485.28 | 12 | South Central | Rocky Mountain DIII | D-III | 1402.8 | 82.49 | 0.06 | |
| 90 | 5 | Bowdoin | 24-4 | 1478.93 | 1 | New England | North New England DIII | D-III | 1240.37 | 238.57 | 0.19 |
| 91 | 20 | Vermont-B | 19-14 | 1478.29 | 60 | New England | New England Dev | Dev | 1487.09 | -8.78 | -0.01 |
| 92 | 2 | Texas A&M | 19-20 | 1477.88 | 19 | South Central | South Texas DI | D-I | 1547.04 | -69.15 | -0.04 |
| 93 | 1 | Yale | 20-12 | 1476.76 | 13 | Metro East | Hudson Valley DI | D-I | 1391.13 | 85.65 | 0.06 |
| 94 | 3 | Cal Poly-CCWR | 4-1 | 1474.67 | 18 | Southwest | SoCal DI | Dev | 1019.68 | 455 | 0.45 |
| 95 | 2 | Southern Illinois-Edwardsville | 22-12 | 1470.96 | 17 | Great Lakes | Illinois DI | D-I | 1372.83 | 98.18 | 0.07 |
| 96 | 2 | Lehigh | 18-11 | 1464.61 | 16 | Ohio Valley | East Penn DI | D-I | 1341.04 | 123.59 | 0.09 |
| 97 | 1 | Missouri | 20-11 | 1459.97 | 18 | South Central | Ozarks DI | D-I | 1299.46 | 160.52 | 0.12 |
| 98 | 1 | SUNY-Buffalo | 14-11 | 1457.75 | 17 | Metro East | Western NY DI | D-I | 1421.4 | 36.36 | 0.03 |
| 99 | 1 | Tennessee-Chattanooga | 18-12 | 1453.61 | 19 | Southeast | Southern Appalachian DI | D-I | 1427.1 | 26.53 | 0.02 |
| 100 | 1 | Syracuse | 20-17 | 1453.35 | 15 | Metro East | Western NY DI | D-I | 1389.15 | 64.21 | 0.05 |
| 101 | 1 | North Carolina-Asheville | 12-6 | 1448.36 | 12 | Atlantic Coast | Atlantic Coast DIII | D-III | 1362.47 | 85.9 | 0.06 |
| 102 | 2 | Alabama | 22-16 | 1447.3 | 18 | Southeast | Gulf Coast DI | D-I | 1394.57 | 52.74 | 0.04 |
| 103 | 2 | Berry | 19-3 | 1444.9 | 18 | Southeast | Southeast DIII | D-III | 1137.38 | 307.56 | 0.27 |
| 104 | 1 | Marquette | 14-5 | 1437.96 | 15 | North Central | Lake Superior DI | D-I | 1284.67 | 153.29 | 0.12 |
| 105 | 1 | Appalachian State | 18-19 | 1434.3 | 15 | Atlantic Coast | Carolina DI | D-I | 1480.34 | -46.03 | -0.03 |
| 106 | 2 | Columbia | 18-10 | 1428.85 | 15 | Metro East | Metro NY DI | D-I | 1306.04 | 122.83 | 0.09 |
| 107 | Claremont | 10-4 | 1428.35 | 16 | Southwest | Southwest DIII | D-III | 1281.08 | 147.28 | 0.11 | |
| 108 | 4 | British Columbia -B | 12-15 | 1419.01 | 32 | Northwest | Cascadia DI | Dev | 1434.4 | -15.38 | -0.01 |
| 109 | San Diego State | 23-12 | 1410.79 | 18 | Southwest | SoCal DI | D-I | 1308.78 | 102.02 | 0.08 | |
| 110 | Iowa | 21-10 | 1405.74 | 18 | North Central | West Plains DI | D-I | 1301.53 | 104.21 | 0.08 | |
| 111 | 1 | Liberty | 17-13 | 1388.97 | 17 | Atlantic Coast | Virginia DI | D-I | 1377.23 | 11.77 | 0.01 |
| 112 | 2 | Hillsdale | 12-7 | 1376.1 | 13 | ? | 1205.86 | 170.27 | 0.14 | ||
| 113 | West Chester | 21-12 | 1375.96 | 17 | Ohio Valley | East Penn DI | D-I | 1301.91 | 74.06 | 0.06 | |
| 114 | 2 | Denver | 17-11 | 1375.42 | 9 | South Central | Rocky Mountain DI | D-I | 1322.1 | 53.33 | 0.04 |
| 115 | RIT | 19-15 | 1367 | 17 | Metro East | Western NY DI | D-I | 1318.39 | 48.63 | 0.04 | |
| 116 | 11 | Boston University | 16-12 | 1363.62 | 86 | New England | Metro Boston DI | D-I | 1302.74 | 60.9 | 0.05 |
| 117 | 1 | Colorado Mines | 15-9 | 1363.26 | 9 | South Central | Rocky Mountain DIII | D-III | 1219.76 | 143.5 | 0.12 |
| 118 | 1 | Mississippi State | 23-19 | 1357.25 | 18 | Southeast | Gulf Coast DI | D-I | 1351.61 | 5.67 | 0 |
| 119 | 4 | Connecticut | 18-10 | 1350.18 | 10 | Metro East | Hudson Valley DI | D-I | 1291.36 | 58.83 | 0.05 |
| 120 | 1 | Cal Poly-SLO-B | 14-8 | 1348.07 | 19 | Southwest | Southwest Dev | Dev | 1272.27 | 75.8 | 0.06 |
| 121 | 1 | Arizona State | 8-12 | 1347.3 | 19 | Southwest | Desert DI | D-I | 1381.89 | -34.58 | -0.03 |
| 122 | 1 | Northwestern | 10-14 | 1344.78 | 19 | Great Lakes | Illinois DI | D-I | 1422.09 | -77.31 | -0.05 |
| 123 | 10 | Bates | 16-13 | 1344.49 | 19 | New England | North New England DIII | D-III | 1349.93 | -5.43 | 0 |
| 124 | 2 | Clemson | 17-12 | 1343.98 | 18 | Atlantic Coast | Carolina DI | D-I | 1317.06 | 26.95 | 0.02 |
| 125 | 9 | Maine | 11-9 | 1340.26 | 16 | New England | Greater New England DI | D-I | 1407.71 | -67.44 | -0.05 |
| 126 | 2 | San Jose State | 20-13 | 1340.19 | 19 | Southwest | NorCal DI | D-I | 1225.61 | 114.6 | 0.09 |
| 127 | 2 | Butler | 17-9 | 1335.19 | 16 | Great Lakes | East Plains DIII | D-III | 1168.85 | 166.36 | 0.14 |
| 128 | 2 | Central Florida | 13-15 | 1327.67 | 19 | Southeast | Florida DI | D-I | 1377 | -49.32 | -0.04 |
| 129 | Asbury | 15-8 | 1324.98 | 15 | ? | 1188.42 | 136.55 | 0.11 | |||
| 130 | 2 | LSU | 13-15 | 1323.15 | 18 | Southeast | Gulf Coast DI | D-I | 1353.09 | -29.9 | -0.02 |
| 131 | 4 | Santa Clara | 9-13 | 1322.07 | 20 | Southwest | NorCal DI | D-I | 1418.63 | -96.54 | -0.07 |
| 132 | 1 | Kenyon | 16-8 | 1315.76 | 14 | Ohio Valley | Ohio DIII | D-III | 1218.72 | 97.04 | 0.08 |
| 133 | 3 | North Texas | 16-7 | 1313 | 17 | South Central | North Texas DI | D-I | 1156.3 | 156.71 | 0.14 |
| 134 | 2 | Florida State | 13-21 | 1310.77 | 17 | Southeast | Florida DI | D-I | 1365.85 | -55.07 | -0.04 |
| 135 | 3 | Gonzaga | 6-10 | 1308.08 | 5 | Northwest | Big Sky DI | D-I | 1443.55 | -135.46 | -0.09 |
| 136 | 1 | Wisconsin-Eau Claire | 20-11 | 1306.29 | 15 | North Central | Lake Superior DI | D-I | 1197.37 | 108.96 | 0.09 |
| 137 | 29 | Montana State | 8-10 | 1305.33 | 94 | Northwest | Big Sky DI | D-I | 1413.09 | -107.75 | -0.08 |
| 138 | 2 | California-Irvine | 8-10 | 1300.29 | 20 | Southwest | SoCal DI | D-I | 1400.62 | -100.32 | -0.07 |
| 139 | 2 | Wichita State | 3-1 | 1297.37 | 17 | South Central | Ozarks DI | D-I | 1100.47 | 196.91 | 0.18 |
| 140 | George Mason | 13-13 | 1288.12 | 17 | Atlantic Coast | Virginia DI | D-I | 1287.91 | 0.22 | 0 | |
| 141 | 2 | Puget Sound | 12-10 | 1288.06 | 17 | Northwest | Northwest DIII | D-III | 1231.45 | 56.62 | 0.05 |
| 142 | 1 | Pittsburgh-B | 20-12 | 1284.99 | 13 | Ohio Valley | Ohio Valley Dev | Dev | 1214.91 | 70.1 | 0.06 |
| 143 | 1 | Davidson | 14-10 | 1278.6 | 13 | Atlantic Coast | Atlantic Coast DIII | D-III | 1231.1 | 47.54 | 0.04 |
| 144 | 1 | Oberlin | 18-8 | 1270.28 | 15 | Ohio Valley | Ohio DIII | D-III | 1156.98 | 113.33 | 0.1 |
| 145 | 2 | Wisconsin-Milwaukee | 15-15 | 1269.92 | 19 | North Central | Lake Superior DI | D-I | 1260.77 | 9.18 | 0.01 |
| 146 | 2 | South Florida | 9-16 | 1269.39 | 19 | Southeast | Florida DI | D-I | 1361.49 | -92.09 | -0.07 |
| 147 | 1 | SUNY-Binghamton | 8-18 | 1266.17 | 17 | Metro East | Western NY DI | D-I | 1416.62 | -150.44 | -0.11 |
| 148 | 4 | Rhode Island | 16-13 | 1265.72 | 3 | New England | Greater New England DI | D-I | 1308.52 | -42.79 | -0.03 |
| 149 | Rutgers | 14-12 | 1263.64 | 15 | Metro East | Metro NY DI | D-I | 1278.78 | -15.14 | -0.01 | |
| 150 | 3 | Toronto | 7-14 | 1262.59 | 18 | Metro East | Western NY DI | D-I | 1370.78 | -108.18 | -0.08 |
| 151 | 1 | Macalester | 15-14 | 1261.32 | 16 | North Central | Northwoods DIII | D-III | 1277.18 | -15.86 | -0.01 |
| 152 | 1 | Lipscomb | 7-7 | 1253.36 | 19 | Southeast | Southeast DIII | D-III | 1209.36 | 44.01 | 0.04 |
| 153 | Kentucky | 12-11 | 1248.49 | 17 | Great Lakes | East Plains DI | D-I | 1301.84 | -53.34 | -0.04 | |
| 154 | 2 | Brigham Young-B | 11-7 | 1244.54 | 1 | Northwest | Big Sky DI | Dev | 1094.38 | 150.18 | 0.14 |
| 155 | 1 | Johns Hopkins | 14-17 | 1238.52 | 18 | Atlantic Coast | Colonial DI | D-I | 1270.61 | -32.08 | -0.03 |
| 156 | 1 | Wisconsin-La Crosse | 14-12 | 1235.7 | 17 | North Central | Lake Superior DI | D-I | 1250.74 | -15.03 | -0.01 |
| 157 | 9 | Grand Valley | 14-13 | 1232.58 | 47 | Great Lakes | Michigan DI | D-I | 1229.11 | 3.54 | 0 |
| 158 | Grinnell | 10-7 | 1220.19 | 14 | North Central | West Plains DIII | D-III | 1159.03 | 61.22 | 0.05 | |
| 159 | 3 | Brandeis | 16-10 | 1217.2 | 11 | New England | Metro Boston DIII | D-III | 1028.73 | 188.48 | 0.18 |
| 160 | 1 | Kansas | 14-10 | 1217.19 | 15 | South Central | Ozarks DI | D-I | 1072.89 | 144.31 | 0.13 |
| 161 | 1 | Ithaca | 17-11 | 1215.04 | 16 | Metro East | Western NY DIII | D-III | 1164.93 | 50.12 | 0.04 |
| 162 | 1 | Delaware | 14-11 | 1213.28 | 17 | Atlantic Coast | Colonial DI | D-I | 1184.41 | 28.89 | 0.02 |
| 163 | 6 | Washington-B | 11-11 | 1211.9 | 28 | Northwest | Cascadia DI | Dev | 1302.84 | -90.93 | -0.07 |
| 164 | 1 | Truman State | 19-9 | 1207.14 | 15 | South Central | Ozarks DIII | D-III | 1117.21 | 89.94 | 0.08 |
| 165 | 1 | Massachusetts -B | 9-14 | 1206.06 | 15 | New England | New England Dev | Dev | 1194.13 | 11.94 | 0.01 |
| 166 | 1 | Pennsylvania | 12-18 | 1194.08 | 16 | Ohio Valley | East Penn DI | D-I | 1266.97 | -72.89 | -0.06 |
| 167 | 2 | Dayton | 12-13 | 1191.95 | 19 | Ohio Valley | Ohio DI | D-I | 1229.8 | -37.78 | -0.03 |
| 168 | Charleston | 9-9 | 1191.69 | 16 | Atlantic Coast | Carolina DI | D-I | 1190.72 | 0.98 | 0 | |
| 169 | Michigan Tech | 13-15 | 1188.6 | 15 | North Central | Lake Superior DIII | D-III | 1130.5 | 58.13 | 0.05 | |
| 170 | Messiah | 12-15 | 1183.27 | 12 | Ohio Valley | West Penn DIII | D-III | 1206.51 | -23.22 | -0.02 | |
| 171 | 5 | Northern Iowa | 16-13 | 1179.26 | 8 | North Central | West Plains DI | D-I | 1118.9 | 60.39 | 0.05 |
| 172 | 1 | Alabama-Birmingham | 14-12 | 1174.88 | 18 | Southeast | Gulf Coast DI | D-I | 1201.2 | -26.28 | -0.02 |
| 173 | 1 | East Carolina | 16-22 | 1166.37 | 18 | Atlantic Coast | Carolina DI | D-I | 1295.06 | -128.68 | -0.1 |
| 174 | 1 | California-Santa Cruz-B | 15-7 | 1162.98 | 17 | Southwest | Southwest Dev | Dev | 947.56 | 215.44 | 0.23 |
| 175 | 2 | California-Davis | 5-19 | 1162.65 | 20 | Southwest | NorCal DI | D-I | 1371.92 | -209.26 | -0.15 |
| 176 | 1 | Hamilton | 8-3 | 1157.41 | 12 | ? | 1008.88 | 148.59 | 0.15 | ||
| 177 | 3 | Minnesota-Duluth | 7-11 | 1155.35 | 25 | North Central | Northwoods DI | D-I | 1102.22 | 53.12 | 0.05 |
| 178 | 1 | Dickinson | 10-18 | 1152.8 | 13 | Ohio Valley | West Penn DIII | D-III | 1237.97 | -85.17 | -0.07 |
| 179 | 1 | Ohio | 19-17 | 1151.21 | 16 | Ohio Valley | Ohio DI | D-I | 1110.76 | 40.48 | 0.04 |
| 180 | Grove City | 6-4 | 1145.07 | 13 | ? | 1219.19 | -74.11 | -0.06 | |||
| 181 | American | 12-13 | 1138.96 | 16 | Atlantic Coast | Colonial DI | D-I | 1186.52 | -47.54 | -0.04 | |
| 182 | Carleton University | 4-9 | 1138.54 | 15 | Metro East | Western NY DI | D-I | 1356.63 | -218.07 | -0.16 | |
| 183 | Tarleton State | 12-5 | 1132.45 | 16 | South Central | North Texas DI | D-I | 1018.91 | 113.55 | 0.11 | |
| 184 | Georgia State | 7-9 | 1116.96 | 18 | Southeast | Southern Appalachian DI | D-I | 1219.4 | -102.44 | -0.08 | |
| 185 | 30 | Northeastern-B | 17-8 | 1116.27 | 100 | New England | New England Dev | Dev | 1071.58 | 44.73 | 0.04 |
| 186 | 1 | Union (Tennessee) | 12-12 | 1112.59 | 17 | Southeast | Southeast DIII | D-III | 1007.11 | 105.5 | 0.1 |
| 187 | 1 | Arizona | 11-8 | 1106.58 | 13 | Southwest | Desert DI | D-I | 1062.4 | 44.19 | 0.04 |
| 188 | Georgia Tech-B | 9-3 | 1101.22 | 17 | Southeast | Southeast Dev | Dev | 898.26 | 202.97 | 0.23 | |
| 189 | Baylor | 14-10 | 1091.24 | 16 | South Central | North Texas DI | D-I | 1011.18 | 80.07 | 0.08 | |
| 190 | Vanderbilt | 9-10 | 1089.21 | 17 | Southeast | Gulf Coast DI | D-I | 1134.05 | -45.6 | -0.04 | |
| 191 | Oklahoma State | 16-12 | 1083.79 | 17 | South Central | Ozarks DI | D-I | 1064.03 | 19.77 | 0.02 | |
| 192 | Vassar | 13-7 | 1083.23 | 10 | ? | 942.72 | 140.26 | 0.15 | |||
| 193 | Miami (Florida) | 10-6 | 1073.38 | 15 | Southeast | Florida DI | D-I | 891.22 | 182.16 | 0.2 | |
| 194 | 1 | Minnesota-B | 10-17 | 1070.89 | 13 | North Central | North Central Dev | Dev | 1105.19 | -34.28 | -0.03 |
| 195 | 1 | John Brown | 9-11 | 1069.63 | 16 | South Central | Ozarks DIII | D-III | 1158.83 | -89.18 | -0.08 |
| 196 | 1 | Haverford | 18-12 | 1068.39 | 10 | Ohio Valley | East Penn DIII | D-III | 998.15 | 70.31 | 0.07 |
| 197 | 1 | Kennesaw State | 6-17 | 1064.17 | 18 | Southeast | Southern Appalachian DI | D-I | 1272.83 | -208.62 | -0.16 |
| 198 | North Carolina-B | 14-10 | 1061.64 | 15 | Atlantic Coast | Southern Atlantic Coast Dev | Dev | 986.36 | 75.31 | 0.08 | |
| 199 | Occidental | 7-7 | 1058.14 | 17 | Southwest | Southwest DIII | D-III | 1068.59 | -10.44 | -0.01 | |
| 200 | 13 | Nebraska | 9-11 | 1056.52 | 62 | North Central | West Plains DI | D-I | 1080.6 | -24.03 | -0.02 |
| 201 | 5 | Tufts-B | 10-7 | 1047.6 | 5 | New England | New England Dev | Dev | 1037.22 | 10.42 | 0.01 |
| 202 | 2 | Cal Poly-Humboldt | 11-12 | 1047.02 | 18 | Southwest | NorCal DI | D-I | 1066.35 | -19.32 | -0.02 |
| 203 | 1 | Eastern Michigan | 9-8 | 1043.18 | 16 | Great Lakes | Michigan DI | D-I | 1012.33 | 30.88 | 0.03 |
| 204 | 3 | Saint Louis | 7-19 | 1042.38 | 18 | South Central | Ozarks DI | D-I | 1261.65 | -219.26 | -0.17 |
| 205 | 2 | North Carolina State-B | 14-7 | 1040.51 | 15 | Atlantic Coast | Southern Atlantic Coast Dev | Dev | 842.99 | 197.54 | 0.23 |
| 206 | 2 | Winona State | 14-9 | 1032.17 | 14 | North Central | Northwoods DIII | D-III | 948.54 | 83.68 | 0.09 |
| 207 | 2 | Missouri State | 6-4 | 1028.03 | 16 | ? | 845.19 | 182.93 | 0.22 | ||
| 208 | 1 | Towson | 10-13 | 1024.8 | 14 | Atlantic Coast | Colonial DI | D-I | 1130.59 | -105.78 | -0.09 |
| 209 | 1 | Penn State-B | 18-8 | 1024.7 | 3 | Ohio Valley | Ohio Valley Dev | Dev | 897.48 | 127.24 | 0.14 |
| 210 | 2 | Wisconsin-Whitewater | 7-11 | 1020.85 | 13 | North Central | Lake Superior DI | D-I | 1137.3 | -116.45 | -0.1 |
| 211 | 2 | Vermont-C | 6-1 | 1015.81 | 5 | New England | ? | 615.69 | 399.13 | 0.65 | |
| 212 | 3 | Cedarville | 8-15 | 1015.17 | 16 | Ohio Valley | Ohio DIII | D-III | 1078.69 | -63.51 | -0.06 |
| 213 | 1 | SUNY-Albany | 10-13 | 1012.42 | 11 | Metro East | Hudson Valley DI | D-I | 1050 | -37.56 | -0.04 |
| 214 | 3 | UCLA-B | 13-15 | 1007.79 | 18 | Southwest | Southwest Dev | Dev | 993.67 | 14.14 | 0.01 |
| 215 | 2 | Akron | 10-11 | 997.92 | 16 | Ohio Valley | Ohio DI | D-I | 1131.03 | -133.08 | -0.12 |
| 216 | 3 | Princeton | 9-12 | 997.06 | 13 | Metro East | Metro NY DI | D-I | 1150.11 | -153.02 | -0.13 |
| 217 | 1 | Cal Poly-Pomona | 4-12 | 996.29 | 19 | Southwest | SoCal DI | D-I | 1216.5 | -220.2 | -0.18 |
| 218 | Miami (Ohio) | 14-10 | 996.18 | 16 | Ohio Valley | Ohio DI | D-I | 976.35 | 19.88 | 0.02 | |
| 219 | 1 | Texas-B | 7-4 | 985.24 | 15 | South Central | South Texas DI | Dev | 892.6 | 92.65 | 0.1 |
| 220 | 1 | Christopher Newport | 6-13 | 981.36 | 14 | Atlantic Coast | Atlantic Coast DIII | D-III | 1198.53 | -217.18 | -0.18 |
| 221 | 6 | Michigan-B | 12-16 | 979.37 | 17 | Great Lakes | Great Lakes Dev | Dev | 1078.78 | -99.8 | -0.09 |
| 222 | 8 | MIT | 11-14 | 976.13 | 45 | New England | Metro Boston DI | D-I | 1068.77 | -92.62 | -0.09 |
| 223 | 1 | Wisconsin-B | 12-13 | 976.06 | 14 | North Central | North Central Dev | Dev | 1078.13 | -102.05 | -0.09 |
| 224 | 1 | Arkansas | 8-12 | 959.82 | 16 | South Central | Ozarks DI | D-I | 1083.07 | -123.25 | -0.11 |
| 225 | 1 | Oregon-B | 6-11 | 955.44 | 21 | Northwest | Cascadia DI | Dev | 1167.28 | -211.83 | -0.18 |
| 226 | West Virginia | 14-7 | 948.77 | 15 | Ohio Valley | West Penn DI | D-I | 894.07 | 54.21 | 0.06 | |
| 227 | 2 | Ave Maria-B | 3-2 | 946.89 | 11 | Southeast | Southeast DIII | D-III | 575.68 | 371.22 | 0.64 |
| 228 | Embry-Riddle | 6-5 | 945.96 | 16 | Southeast | Southeast DIII | D-III | 870.03 | 75.94 | 0.09 | |
| 229 | 1 | Harvard | 7-11 | 939.03 | 18 | New England | Metro Boston DI | D-I | 1092.62 | -153.55 | -0.14 |
| 230 | 1 | Air Force | 4-14 | 927.9 | 14 | South Central | Rocky Mountain DIII | D-III | 1197.48 | -269.56 | -0.23 |
| 231 | 8 | Colby | 11-12 | 927.19 | 56 | New England | North New England DIII | D-III | 1068.74 | -141.54 | -0.13 |
| 232 | George Washington | 6-12 | 924.71 | 16 | Atlantic Coast | Colonial DI | D-I | 1055.82 | -131.11 | -0.12 | |
| 233 | Georgia Southern | 9-14 | 918.6 | 17 | Southeast | Southern Appalachian DI | D-I | 969.09 | -50.48 | -0.05 | |
| 234 | Scranton | 2-5 | 916.57 | 12 | ? | 1082 | -165.39 | -0.15 | |||
| 235 | Skidmore | 15-12 | 915.2 | 12 | Metro East | Hudson Valley DIII | D-III | 911.35 | 3.93 | 0 | |
| 236 | 2 | Illinois State | 11-20 | 908.05 | 16 | Great Lakes | Illinois DI | D-I | 1114.9 | -206.8 | -0.19 |
| 237 | Loyola Marymount | 5-12 | 907.24 | 18 | Southwest | SoCal DI | D-I | 1119.32 | -212.06 | -0.19 | |
| 238 | 2 | Virginia Commonwealth | 2-15 | 905.77 | 21 | Atlantic Coast | Virginia DI | D-I | 1193.69 | -287.91 | -0.24 |
| 239 | Wake Forest | 8-16 | 904.77 | 15 | Atlantic Coast | Carolina DI | D-I | 1121.5 | -216.71 | -0.19 | |
| 240 | Kalamazoo | 5-8 | 902.48 | 15 | ? | 1044.21 | -141.66 | -0.14 | |||
| 241 | Xavier | 2-17 | 899.56 | 14 | Ohio Valley | Ohio DIII | D-III | 1205.26 | -305.69 | -0.25 | |
| 242 | Grace | 9-12 | 896.1 | 14 | Great Lakes | D-III | 850.1 | 46.04 | 0.05 | ||
| 243 | 1 | College of New Jersey | 10-7 | 893.37 | 9 | Metro East | Metro NY DIII | D-III | 801.79 | 91.66 | 0.11 |
| 244 | 1 | Kent State | 7-15 | 891.15 | 16 | Ohio Valley | Ohio DI | D-I | 1035.56 | -144.36 | -0.14 |
| 245 | Texas-Dallas | 6-12 | 886.38 | 15 | South Central | North Texas DI | D-I | 1056.2 | -169.81 | -0.16 | |
| 246 | 1 | Connecticut College | 11-6 | 885.45 | 4 | Metro East | Hudson Valley DIII | D-III | 762.8 | 122.7 | 0.16 |
| 247 | 1 | Oregon State-B | 5-11 | 877.6 | 20 | Northwest | Cascadia DI | Dev | 1105.37 | -227.76 | -0.21 |
| 248 | NYU | 6-15 | 875.07 | 13 | Metro East | Metro NY DI | D-I | 1126.11 | -251.02 | -0.22 | |
| 249 | Northern Arizona | 5-9 | 871.65 | 14 | Southwest | Desert DI | D-I | 1015.92 | -144.25 | -0.14 | |
| 250 | 31 | Worcester Polytechnic | 10-12 | 867.13 | 103 | New England | South New England DIII | D-III | 870.17 | -3.03 | 0 |
| 251 | 1 | Portland | 8-12 | 864.06 | 20 | Northwest | Northwest DIII | D-III | 952.64 | -88.56 | -0.09 |
| 252 | 1 | Seattle | 3-2 | 858.11 | 20 | Northwest | Northwest DIII | D-III | 696.57 | 161.55 | 0.23 |
| 253 | 9 | Brown-B | 9-11 | 857.11 | 28 | New England | New England Dev | Dev | 916.95 | -59.85 | -0.07 |
| 254 | 2 | East Tennessee State | 7-11 | 854.19 | 16 | Southeast | Southern Appalachian DI | D-I | 927.06 | -72.86 | -0.08 |
| 255 | 1 | Colgate | 3-5 | 851.11 | 11 | ? | 934.6 | -83.48 | -0.09 | ||
| 256 | 3 | St Thomas | 9-14 | 848.88 | 14 | North Central | Northwoods DIII | D-III | 909.85 | -60.97 | -0.07 |
| 257 | 1 | Illinois-B | 14-17 | 845.74 | 15 | Great Lakes | Great Lakes Dev | Dev | 882.36 | -36.7 | -0.04 |
| 258 | 1 | DePaul | 4-11 | 840.77 | 16 | Great Lakes | Illinois DI | D-I | 1092.07 | -251.25 | -0.23 |
| 259 | 1 | Colorado State-B | 7-15 | 840.19 | 4 | South Central | Rocky Mountain DI | Dev | 1015.27 | -175.06 | -0.17 |
| 260 | 5 | Santa Clara-B | 1-2 | 837.41 | 24 | Southwest | ? | 925.16 | -87.74 | -0.09 | |
| 261 | 2 | Florida Tech | 6-3 | 830.03 | 14 | Southeast | Southeast DIII | D-III | 745.85 | 84.19 | 0.11 |
| 262 | 1 | Nevada-Reno | 8-9 | 822.12 | 10 | Southwest | NorCal DI | D-I | 920.77 | -98.64 | -0.11 |
| 263 | 3 | Toledo | 6-11 | 820.43 | 17 | Ohio Valley | Ohio DI | D-I | 927.8 | -108.02 | -0.12 |
| 264 | Virginia Tech-B | 8-10 | 806.34 | 15 | Atlantic Coast | Southern Atlantic Coast Dev | Dev | 837.78 | -31.44 | -0.04 | |
| 265 | 2 | Georgia-B | 5-8 | 806.18 | 16 | Southeast | Southeast Dev | Dev | 879.7 | -73.51 | -0.08 |
| 266 | 1 | Drexel | 13-11 | 805.3 | 11 | Ohio Valley | East Penn DI | D-I | 820.91 | -15.56 | -0.02 |
| 267 | SUNY-Geneseo | 10-15 | 799.71 | 10 | Metro East | Western NY DIII | D-III | 878.74 | -78.98 | -0.09 | |
| 268 | Michigan State-B | 9-6 | 799.33 | 9 | Great Lakes | Great Lakes Dev | Dev | 720.98 | 78.54 | 0.11 | |
| 269 | Grand Canyon-B | 2-4 | 798.15 | 9 | Southwest | Southwest Dev | Dev | 932.01 | -133.85 | -0.14 | |
| 270 | Valparaiso | 2-7 | 796.4 | 11 | ? | 1080.43 | -284.01 | -0.26 | |||
| 271 | 5 | Wisconsin-Platteville | 5-15 | 795.62 | 16 | North Central | Lake Superior DIII | D-III | 1018.66 | -223.02 | -0.22 |
| 272 | 1 | Wooster | 4-2 | 792.52 | 14 | Ohio Valley | Ohio DIII | D-III | 712.6 | 79.89 | 0.11 |
| 273 | Minnesota State-Mankato | 8-4 | 788.71 | 15 | North Central | North Central Dev | D-I | 779.81 | 8.92 | 0.01 | |
| 274 | 2 | Oklahoma | 9-14 | 787.3 | 18 | South Central | Ozarks DI | D-I | 894.03 | -106.72 | -0.12 |
| 275 | 31 | Bryant | 4-2 | 776.95 | 111 | New England | South New England DIII | D-III | 717.41 | 59.56 | 0.08 |
| 276 | 2 | St John's (Minnesota) | 5-11 | 772.54 | 16 | North Central | Northwoods DIII | D-III | 922.85 | -151.03 | -0.16 |
| 277 | Salisbury | 9-7 | 769.52 | 10 | Atlantic Coast | Atlantic Coast DIII | D-III | 827.3 | -58.01 | -0.07 | |
| 278 | 3 | Texas Tech | 7-8 | 768.35 | 20 | South Central | North Texas DI | D-I | 856.86 | -88.51 | -0.1 |
| 279 | 3 | Chico State | 2-14 | 766.49 | 18 | Southwest | NorCal DI | D-I | 1048.1 | -281.6 | -0.27 |
| 280 | 2 | Jacksonville State | 5-11 | 766.09 | 12 | Southeast | Gulf Coast DI | D-I | 834.15 | -68.05 | -0.08 |
| 281 | 2 | California-B | 10-19 | 761.82 | 15 | Southwest | Southwest Dev | Dev | 917.25 | -155.42 | -0.17 |
| 282 | 5 | Roger Williams | 6-7 | 761.48 | 13 | ? | 724.66 | 36.83 | 0.05 | ||
| 283 | 3 | Texas-San Antonio | 6-11 | 760.62 | 17 | South Central | South Texas DI | D-I | 832.34 | -71.71 | -0.09 |
| 284 | 10 | Northeastern-C | 14-13 | 757.13 | 29 | New England | New England Dev | Dev | 814.64 | -57.48 | -0.07 |
| 285 | 3 | Navy | 1-14 | 750.44 | 13 | Atlantic Coast | Atlantic Coast DIII | D-III | 1097.14 | -346.65 | -0.32 |
| 286 | 3 | Montana | 3-7 | 749.22 | 13 | Northwest | Big Sky DI | D-I | 839.99 | -90.75 | -0.11 |
| 287 | 4 | Texas State | 8-13 | 745.81 | 17 | South Central | South Texas DI | D-I | 830.36 | -84.54 | -0.1 |
| 288 | 4 | Harding | 8-28 | 745.34 | 16 | South Central | Ozarks DIII | D-III | 1034.52 | -289.17 | -0.28 |
| 289 | 4 | Southern California-B | 6-6 | 739.54 | 14 | Southwest | Southwest Dev | Dev | 778.01 | -38.46 | -0.05 |
| 290 | 4 | North Florida | 0-8 | 731.48 | 18 | Southeast | Florida DI | D-I | 1275.53 | -544.05 | -0.43 |
| 291 | 3 | Carleton College-C | 3-7 | 724.27 | 15 | North Central | Northwoods DIII | D-III | 947.68 | -223.18 | -0.24 |
| 292 | 2 | Mary Washington | 2-8 | 722.23 | 12 | Atlantic Coast | Atlantic Coast DIII | D-III | 927.3 | -205.03 | -0.22 |
| 293 | 19 | Amherst | 8-14 | 721.01 | 92 | New England | South New England DIII | D-III | 778.8 | -57.78 | -0.07 |
| 294 | 2 | Ball State | 8-14 | 714.61 | 16 | Great Lakes | East Plains DI | D-I | 881.31 | -166.53 | -0.19 |
| 295 | 4 | Reed | 6-11 | 713.31 | 18 | Northwest | Northwest DIII | D-III | 837.28 | -123.96 | -0.15 |
| 296 | 3 | Trinity | 7-13 | 711.59 | 17 | South Central | Texas DIII | D-III | 765.71 | -54.11 | -0.07 |
| 297 | 1 | Loyola-Chicago | 8-15 | 701.18 | 16 | Great Lakes | Illinois DI | D-I | 843.71 | -142.45 | -0.17 |
| 298 | 1 | Knox | 6-10 | 696.55 | 14 | Great Lakes | Illinois DIII | D-III | 674.75 | 21.01 | 0.03 |
| 299 | 4 | Creighton | 0-4 | 696.43 | 25 | ? | 1214.48 | -518.05 | -0.43 | ||
| 300 | 2 | Maryland-Baltimore County | 3-11 | 685.62 | 15 | Atlantic Coast | Colonial DI | D-I | 1015.32 | -329.68 | -0.32 |
| 301 | 2 | California-Santa Barbara-B | 3-12 | 670.56 | 17 | Southwest | Southwest Dev | Dev | 878.28 | -207.7 | -0.24 |
| 302 | 2 | Wisconsin-Stevens Point | 2-9 | 669.31 | 12 | North Central | Lake Superior DI | D-I | 1072.47 | -403.16 | -0.38 |
| 303 | 2 | Luther | 8-10 | 665.96 | 15 | North Central | West Plains DIII | D-III | 749.77 | -83.83 | -0.11 |
| 304 | 2 | Western Michigan | 3-13 | 665.74 | 15 | Great Lakes | Michigan DI | D-I | 999.88 | -334.14 | -0.33 |
| 305 | 37 | Stonehill | 1-2 | 664.34 | 154 | ? | 829.74 | -165.39 | -0.2 | ||
| 306 | 3 | Tennessee Tech | 1-11 | 654.18 | 18 | Southeast | Southern Appalachian DI | D-I | 1112.8 | -458.53 | -0.41 |
| 307 | 3 | Cleveland State | 2-2 | 653.92 | 14 | ? | 480.13 | 173.78 | 0.36 | ||
| 308 | 3 | Sam Houston | 7-9 | 651.31 | 16 | South Central | South Texas DI | D-I | 666.21 | -14.89 | -0.02 |
| 309 | 2 | Whitworth | 3-6 | 636.65 | 20 | Northwest | Northwest DIII | D-III | 783.08 | -146.42 | -0.19 |
| 310 | 38 | Bentley | 2-10 | 636.01 | 178 | New England | Metro Boston DIII | D-III | 982.45 | -346.43 | -0.35 |
| 311 | 1 | Swarthmore | 5-4 | 632.71 | 5 | Ohio Valley | East Penn DIII | D-III | 634.71 | -2.35 | 0 |
| 312 | 4 | Illinois-Chicago | 3-9 | 630.93 | 16 | Great Lakes | Illinois DI | D-I | 724.81 | -93.89 | -0.13 |
| 313 | 4 | Washington University-B | 5-17 | 626.37 | 15 | South Central | Ozarks DI | Dev | 871.65 | -245.26 | -0.28 |
| 314 | 1 | Rowan | 12-15 | 623.62 | 5 | Metro East | Metro NY DI | D-I | 638.01 | -14.55 | -0.02 |
| 315 | 4 | Hartford | 3-4 | 622.74 | 9 | ? | 998.97 | -376.19 | -0.38 | ||
| 316 | 2 | Massachusetts-Lowell | 7-11 | 619.5 | 7 | New England | Metro Boston DI | D-I | 703.33 | -84.26 | -0.12 |
| 317 | 3 | Willamette | 3-5 | 606.53 | 19 | Northwest | Northwest DIII | D-III | 590.83 | 15.71 | 0.03 |
| 318 | 2 | Arizona State-B | 2-8 | 602.98 | 15 | Southwest | Southwest Dev | Dev | 855.3 | -252.31 | -0.29 |
| 319 | 4 | Pacific Lutheran | 4-12 | 601.14 | 18 | Northwest | Northwest DIII | D-III | 761.73 | -160.58 | -0.21 |
| 320 | 3 | Minnesota-C | 7-14 | 596.3 | 20 | North Central | North Central Dev | Dev | 648.88 | -52.57 | -0.08 |
| 321 | 2 | Mississippi | 3-14 | 595.55 | 17 | Southeast | Gulf Coast DI | D-I | 931.97 | -336.36 | -0.36 |
| 322 | 3 | Central Connecticut State | 9-15 | 595.07 | 3 | Metro East | Hudson Valley DI | D-I | 660.97 | -66.04 | -0.1 |
| 323 | 2 | Cincinnati -B | 6-11 | 590.77 | 11 | Ohio Valley | Ohio Valley Dev | Dev | 698.33 | -107.44 | -0.15 |
| 324 | 2 | Kansas State | 2-15 | 587.15 | 14 | South Central | Ozarks DI | D-I | 965.4 | -378.24 | -0.39 |
| 325 | 5 | Mississippi State-B | 5-12 | 586.73 | 16 | Southeast | Southeast Dev | Dev | 801.46 | -214.7 | -0.27 |
| 326 | 2 | Samford | 3-4 | 584.13 | 14 | Southeast | Western Southeast DIII | D-III | 591.21 | -7.08 | -0.01 |
| 327 | 4 | Rice | 5-8 | 582.11 | 17 | South Central | Texas DIII | D-III | 643.15 | -61.02 | -0.09 |
| 328 | 2 | Case Western Reserve-B | 6-6 | 575.65 | 9 | Ohio Valley | Ohio Valley Dev | Dev | 644.47 | -68.83 | -0.11 |
| 329 | 6 | Connecticut-B | 13-13 | 575 | 16 | Metro East | Metro East Dev | Dev | 520.44 | 54.65 | 0.1 |
| 330 | 2 | SUNY-Cortland | 4-17 | 571.4 | 10 | Metro East | Western NY DIII | D-III | 911.54 | -340.41 | -0.37 |
| 331 | Hofstra | 11-16 | 570.89 | 4 | Metro East | Metro NY DI | D-I | 593 | -21.98 | -0.04 | |
| 332 | 3 | Villanova | 4-18 | 569.58 | 7 | Ohio Valley | East Penn DI | D-I | 818.78 | -249.18 | -0.3 |
| 333 | 6 | Cal State-Long Beach | 1-14 | 565.67 | 17 | Southwest | SoCal DI | D-I | 959.5 | -393.81 | -0.41 |
| 334 | 4 | South Carolina-B | 7-20 | 560.45 | 15 | Atlantic Coast | Southern Atlantic Coast Dev | Dev | 760.17 | -199.71 | -0.26 |
| 335 | 2 | Florida-B | 5-5 | 558.56 | 8 | Southeast | Southeast Dev | Dev | 621.11 | -62.53 | -0.1 |
| 336 | 4 | Texas A&M-B | 5-12 | 556.45 | 17 | South Central | South Texas DI | Dev | 725.46 | -169 | -0.23 |
| 337 | 1 | Pennsylvania Western | 6-11 | 551.1 | 6 | Ohio Valley | West Penn DI | D-I | 733.63 | -182.18 | -0.25 |
| 338 | 4 | Penn State-Behrend | 3-5 | 548.76 | 13 | Ohio Valley | West Penn DIII | D-III | 785.44 | -236.66 | -0.3 |
| 339 | 2 | Delaware-B | 8-8 | 531.99 | 13 | Atlantic Coast | Colonial Dev | Dev | 521.92 | 10.07 | 0.02 |
| 340 | 2 | Rose-Hulman | 5-19 | 529.44 | 13 | Great Lakes | D-III | 815.15 | -285.66 | -0.35 | |
| 341 | 2 | Alabama-B | 5-9 | 519.63 | 14 | Southeast | Southeast Dev | Dev | 694.8 | -175.17 | -0.25 |
| 342 | 2 | Stanford-B | 0-5 | 512.29 | 21 | Southwest | NorCal Dev | Dev | 869.62 | -357.32 | -0.41 |
| 343 | 2 | Virginia-B | 10-7 | 502.85 | 14 | Atlantic Coast | Southern Atlantic Coast Dev | Dev | 421.46 | 81.45 | 0.19 |
| 344 | 25 | Holy Cross | 1-7 | 498.32 | 160 | ? | 831.75 | -333.41 | -0.4 | ||
| 345 | 2 | Chicago-B | 2-3 | 492.07 | 12 | Great Lakes | ? | 641.92 | -152.42 | -0.24 | |
| 346 | 2 | Clemson-B | 0-6 | 463.85 | 15 | Atlantic Coast | Carolina DI | Dev | 824.9 | -361.04 | -0.44 |
| 347 | 2 | North Park | 3-3 | 458.81 | 15 | ? | 554.14 | -95.36 | -0.17 | ||
| 348 | 2 | Wright State | 4-18 | 455.5 | 15 | Ohio Valley | Ohio DI | D-I | 802.96 | -347.4 | -0.43 |
| 349 | 2 | Rensselaer Polytech | 5-18 | 454.88 | 6 | Metro East | Hudson Valley DIII | D-III | 870.81 | -415.9 | -0.48 |
| 350 | 12 | Western New England | 2-9 | 445.55 | 77 | New England | South New England DIII | D-III | 544.79 | -99.25 | -0.18 |
| 351 | 12 | Clark | 3-8 | 421.7 | 53 | ? | 669.29 | -247.54 | -0.37 | ||
| 352 | 2 | California-San Diego-B | 4-13 | 420.58 | 16 | Southwest | Southwest Dev | Dev | 654.38 | -233.78 | -0.36 |
| 353 | 2 | Purdue-B | 6-10 | 420.2 | 9 | Great Lakes | Great Lakes Dev | Dev | 529.99 | -108.2 | -0.2 |
| 354 | 5 | Washington State | 2-5 | 420.17 | 20 | Northwest | Big Sky DI | D-I | 606.14 | -185.95 | -0.31 |
| 355 | 3 | Army | 2-9 | 413.85 | 3 | Metro East | Hudson Valley DIII | D-III | 767.45 | -353.47 | -0.46 |
| 356 | 3 | Lehigh-B | 5-8 | 411.44 | 2 | Ohio Valley | East Penn DIII | D-III | 539.67 | -128.13 | -0.24 |
| 357 | 3 | Colorado Mesa | 3-8 | 403.64 | 12 | South Central | Rocky Mountain DI | D-I | 615.83 | -212.18 | -0.34 |
| 358 | 4 | Indiana-B | 3-3 | 403.06 | 6 | Great Lakes | ? | 410.66 | -10.97 | -0.03 | |
| 359 | 3 | Cornell-B | 12-14 | 397.78 | 2 | Metro East | Metro East Dev | Dev | 506.86 | -109.18 | -0.22 |
| 360 | 5 | Dayton-B | 2-4 | 396.22 | 7 | Ohio Valley | Ohio Valley Dev | Dev | 505.71 | -109.55 | -0.22 |
| 361 | 3 | MIT-B | 3-7 | 385.03 | 17 | New England | ? | 584.04 | -199.01 | -0.34 | |
| 362 | 4 | SUNY-Oneonta | 1-4 | 382.31 | 11 | ? | 740.74 | -358.33 | -0.48 | ||
| 363 | 6 | Bethel | 0-5 | 378.16 | 15 | ? | 856.53 | -478 | -0.56 | ||
| 364 | 5 | Georgia College | 1-14 | 376.99 | 16 | Southeast | Southeast DIII | D-III | 811.79 | -434.78 | -0.54 |
| 365 | 4 | SUNY-Buffalo-B | 4-8 | 371.68 | 2 | Metro East | Metro East Dev | Dev | 397.26 | -25.51 | -0.06 |
| 366 | 1 | High Point | 0-5 | 348.77 | 12 | ? | 829.18 | -480.32 | -0.58 | ||
| 367 | 1 | Boise State | 1-10 | 348.32 | 2 | Northwest | Big Sky DI | D-I | 785.4 | -437.07 | -0.56 |
| 368 | 1 | Dallas | 4-12 | 329.59 | 17 | South Central | Texas DIII | D-III | 495.96 | -166.35 | -0.34 |
| 369 | 1 | Radford | 0-6 | 322.87 | 21 | ? | 905.77 | -582.89 | -0.64 | ||
| 370 | 12 | Wentworth | 2-8 | 309.43 | 70 | ? | 572.87 | -263.38 | -0.46 | ||
| 371 | 1 | Morehouse | 1-8 | 299 | 15 | ? | 637.34 | -338.33 | -0.53 | ||
| 372 | 1 | Northwestern-B | 1-3 | 298.6 | 12 | Great Lakes | Great Lakes Dev | Dev | 531.88 | -232.04 | -0.44 |
| 373 | 1 | Nova Southeastern | 2-3 | 294.19 | 4 | Southeast | Florida DI | D-I | 507.92 | -213.73 | -0.42 |
| 374 | 1 | Harvard-B | 4-17 | 287.2 | 20 | New England | New England Dev | Dev | 462.79 | -175.55 | -0.38 |
| 375 | 2 | LSU-B | 0-4 | 275.62 | 17 | Southeast | Southeast Dev | Dev | 646.51 | -370.9 | -0.57 |
| 376 | 9 | New Hampshire | 1-10 | 274.79 | 72 | New England | Greater New England DI | D-I | 611.18 | -336.38 | -0.55 |
| 377 | 3 | Cal Poly-SLO-C | 0-5 | 271.44 | 17 | Southwest | Southern Southwest Dev | Dev | 815.48 | -544.02 | -0.67 |
| 378 | 1 | Denver-B | 1-15 | 264.1 | 1 | South Central | Rocky Mountain DI | Dev | 590.93 | -326.82 | -0.55 |
| 379 | 3 | San Diego State-B | 1-14 | 250.94 | 16 | Southwest | Southwest Dev | Dev | 641.31 | -390.36 | -0.61 |
| 380 | 1 | SUNY-Binghamton-B | 7-7 | 245.04 | 0 | Metro East | Metro East Dev | Dev | 370.06 | -125.33 | -0.34 |
| 381 | 3 | Portland State | 1-15 | 239.95 | 19 | Northwest | Cascadia DI | D-I | 682.29 | -442.34 | -0.65 |
| 382 | 2 | Southern Connecticut State | 0-6 | 239.83 | 6 | ? | 738.11 | -498.17 | -0.67 | ||
| 383 | 4 | James Madison-B | 5-6 | 232.48 | 14 | Atlantic Coast | ? | 257.57 | -25.09 | -0.1 | |
| 384 | 1 | West Chester-B | 7-17 | 224.54 | 2 | Ohio Valley | Ohio Valley Dev | Dev | 477.94 | -253.64 | -0.53 |
| 385 | 1 | Carthage | 1-11 | 203.76 | 16 | North Central | Lake Superior DIII | D-III | 702.09 | -498.33 | -0.71 |
| 386 | 2 | New Jersey Tech | 2-6 | 194.55 | 6 | ? | 356.45 | -161.78 | -0.45 | ||
| 387 | Providence | 1-5 | 194.13 | 1 | ? | 545.1 | -350.94 | -0.64 | |||
| 388 | 2 | SUNY-Stony Brook | 1-5 | 193.97 | 1 | Metro East | Metro NY DI | D-I | 476.3 | -282.42 | -0.59 |
| 389 | Stevens Tech | 7-13 | 186.02 | 1 | Metro East | Metro NY DIII | D-III | 209.93 | -23.72 | -0.11 | |
| 390 | Bradley | 2-4 | 166.43 | 14 | ? | 378.46 | -211.5 | -0.56 | |||
| 391 | Colorado Mines-B | 0-6 | 153.99 | 2 | South Central | Rocky Mountain DIII | D-III | 480.98 | -326.97 | -0.68 | |
| 392 | 7 | Middlebury-B | 1-9 | 138.34 | 52 | New England | North New England DIII | D-III | 280.02 | -141.67 | -0.51 |
| 393 | 1 | Wisconsin-C | 4-8 | 124.17 | 17 | North Central | North Central Dev | Dev | 255.6 | -131.42 | -0.51 |
| 394 | 1 | Tennessee-Chattanooga -B | 0-7 | 123.18 | 15 | Southeast | Southeast Dev | Dev | 632.48 | -509.28 | -0.81 |
| 395 | 1 | Stephen F Austin | 1-15 | 120.84 | 17 | South Central | North Texas DI | D-I | 462.72 | -341.86 | -0.74 |
| 396 | 1 | Maryland-B | 7-17 | 107.67 | 14 | Atlantic Coast | Colonial Dev | Dev | 266.67 | -158.97 | -0.6 |
| 397 | 1 | Ohio-B | 2-7 | 94.65 | 14 | Ohio Valley | Ohio Valley Dev | Dev | 247.61 | -153.05 | -0.62 |
| 398 | 1 | South Florida-B | 0-15 | 94.17 | 8 | Southeast | Southeast Dev | Dev | 543.88 | -449.69 | -0.83 |
| 399 | 1 | Iowa-B | 2-8 | 78.49 | 17 | North Central | ? | 365.71 | -287.19 | -0.79 | |
| 400 | Angelo State | 1-10 | 65.88 | 17 | ? | 402.58 | -336.69 | -0.84 | |||
| 401 | George Washington-B | 10-13 | 13.1 | 14 | Atlantic Coast | Colonial Dev | Dev | -9.94 | 23.05 | -2.32 | |
| 402 | Wisconsin-Milwaukee-B | 4-11 | 2.25 | 16 | North Central | North Central Dev | Dev | 73.81 | -71.58 | -0.97 | |
| 403 | Notre Dame-B | 2-8 | -9.61 | 10 | Great Lakes | ? | 244.56 | -256.61 | -1.05 | ||
| 404 | Georgetown-B | 6-5 | -19.72 | 14 | Atlantic Coast | Colonial Dev | Dev | 2.16 | -21.87 | -10.1 | |
| 405 | 1 | Dartmouth-B | 1-7 | -33.81 | 11 | New England | North New England DIII | D-III | 304.96 | -338.75 | -1.11 |
| 406 | 1 | William & Mary-B | 1-9 | -43.73 | 14 | Atlantic Coast | ? | 247.34 | -291.07 | -1.18 | |
| 407 | RIT-B | 2-4 | -55.93 | 1 | Metro East | ? | -30.32 | -25.54 | 0.84 | ||
| 408 | Richmond-B | 1-2 | -117.36 | 14 | Atlantic Coast | ? | -104.18 | -13.17 | 0.13 | ||
| 409 | Tufts-C | 0-4 | -144.06 | 17 | New England | ? | 385.03 | -529.06 | -1.37 | ||
| 410 | Illinois-C | 1-7 | -191.96 | 10 | Great Lakes | ? | 169.91 | -361.91 | -2.13 | ||
| 411 | Boston University-B | 0-9 | -202.13 | 8 | New England | ? | 363.59 | -565.67 | -1.56 | ||
| - | Manhattan | 0-2 | -232.38 | 1 | ? | 186.02 | -418.57 | -2.25 | |||
| 412 | Carnegie Mellon-B | 0-6 | -296.3 | 2 | Ohio Valley | ? | 224.54 | -520.58 | -2.32 | ||
| 413 | American-B | 1-16 | -314.38 | 14 | Atlantic Coast | Colonial Dev | Dev | 15.75 | -330.12 | -20.96 | |
| 414 | Marquette-B | 1-4 | -318.98 | 16 | North Central | ? | -136.02 | -182.95 | 1.35 | ||
| 415 | New Haven | 1-8 | -342.9 | 1 | ? | -211.87 | -131.19 | 0.62 | |||
| 416 | 1 | Siena | 0-11 | -413.82 | 1 | Metro East | Hudson Valley DIII | D-III | 186.02 | -600 | -3.23 |
| 417 | 1 | Denison | 0-5 | -417.15 | 14 | Ohio Valley | Ohio DIII | D-III | 100.86 | -517.96 | -5.14 |
| 418 | 1 | SUNY-Albany-B | 0-12 | -501.92 | 1 | Metro East | Metro East Dev | Dev | 18.82 | -520.69 | -27.67 |
| 419 | 1 | Iowa State-B | 1-8 | -512.6 | 16 | North Central | ? | -228.21 | -284.36 | 1.25 | |
| 420 | Union (New York) | 0-5 | -605.75 | 1 | ? | -342.9 | -262.67 | 0.77 | |||
| 421 | Grinnell-B | 0-3 | -637.59 | 16 | North Central | ? | -512.6 | -125 | 0.24 | ||
| - | Caltech | 0-2 | ? | NaN | NaN | NaN | |||||
| 422 | Wisconsin-Eau Claire-B | 0-5 | North Central | North Central Dev | Dev | NaN | NaN | NaN | |||
| 423 | Northern Michigan | 0-6 | ? | NaN | NaN | NaN | |||||
| 424 | Slippery Rock | 0-4 | ? | NaN | NaN | NaN |
FAQ
The results on this page ("USAU") are the results of an implementation of the USA Ultimate Top 20 algorithm, which is used to allocate post season bids to both colleg and club ultimate teams. The data was obtained by scraping USAU's score reporting website. Learn more about the algorithm here. TL;DR, here is the rating function. Every game a team plays gets a rating equal to the opponents rating +/- the score value. With all these data points, we iterate team ratings until convergence. There is also a rule for discounting blowout games (see next FAQ)
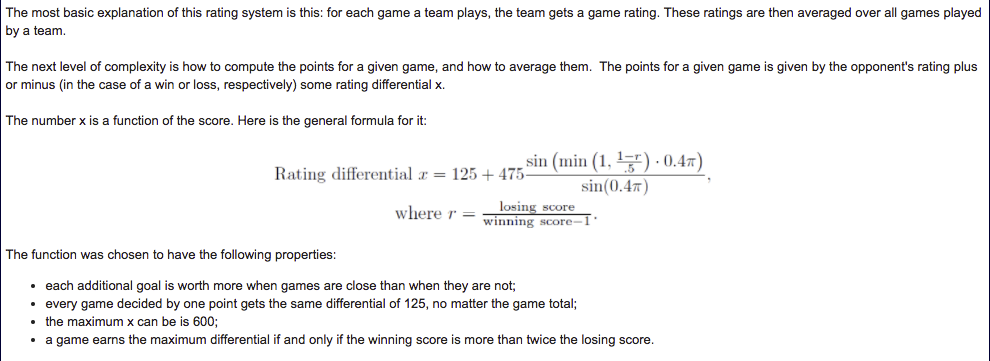
For reference, here is handy table with frequent game scrores and the resulting game value:
For reference, here is handy table with frequent game scrores and the resulting game value:
"...if a team is rated more than 600 points higher than its opponent, and wins with a score that is more than twice the losing score plus one, the game is ignored for ratings purposes. However, this is only done if the winning team has at least N other results that are not being ignored, where N=5."
Translation: if a team plays a game where even earning the max point win would hurt them, they can have the game ignored provided they win by enough and have suffficient unignored results.
Translation: if a team plays a game where even earning the max point win would hurt them, they can have the game ignored provided they win by enough and have suffficient unignored results.