Club Women's USAU Rankings
2024-25 Season
Data updated through May 4 at 8:45pm EDT (some scores likely missing)
GL 1 · MA 2 · NC 1 · NE 4 · NW 3 · SC 1 · SE 1 · SW 3
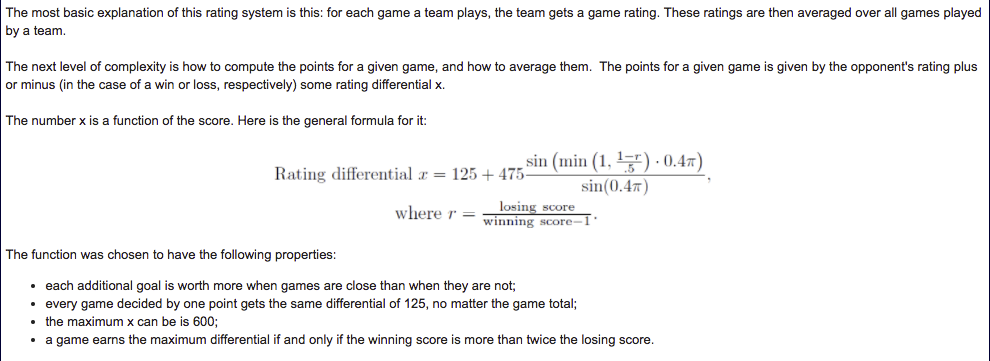
| Rank | Change | Team | Record | Rating | Change | Region | Conference | SoS | PDC | % |
|---|---|---|---|---|---|---|---|---|---|---|
| 1 | Fury SW 1 | 10-1 | 2646.16 | 91 | Southwest | NorCal | 2323.24 | 322.92 | 0.14 | |
| 2 | Scandal MA 1 | 9-2 | 2455.49 | 91 | Mid-Atlantic | Capital | 2201.42 | 254.07 | 0.12 | |
| 3 | Molly Brown SC 1 | 11-1 | 2443.96 | 91 | South Central | Rocky Mountain | 2124.53 | 319.43 | 0.15 | |
| 4 | Flipside SW 2 | 7-5 | 2284.47 | 91 | Southwest | So Cal | 2214.33 | 70.14 | 0.03 | |
| 5 | Brute Squad NE 1 | 7-4 | 2274.02 | 91 | Northeast | East New England | 2157.45 | 116.57 | 0.05 | |
| 6 | Phoenix SE 1 | 5-5 | 2184.13 | 91 | Southeast | North Carolina | 2251.94 | -67.81 | -0.03 | |
| 7 | Seattle Riot NW 1 | 9-3 | 2127.02 | 91 | Northwest | Washington/BC | 1863.75 | 263.27 | 0.14 | |
| 8 | 6ixers NE 2 | 9-3 | 2126.25 | 91 | Northeast | Upstate NY | 1954.82 | 171.43 | 0.09 | |
| 9 | BENT NE 3 | 6-4 | 2103.5 | 90 | Northeast | Metro NY | 2030.32 | 73.18 | 0.04 | |
| 10 | Traffic NW 2 | 8-3 | 2095.48 | 94 | Northwest | Washington/BC | 1925.5 | 169.98 | 0.09 | |
| 11 | Schwa NW 3 | 17-5 | 2045.27 | 92 | Northwest | Oregon | 1901.59 | 143.68 | 0.08 | |
| 12 | Parcha MA 2 | 8-4 | 1890.83 | 90 | Mid-Atlantic | Founders | 1854.85 | 35.97 | 0.02 | |
| 13 | Iris NE 4 | 6-6 | 1851.58 | 89 | Northeast | West New England | 1847.72 | 3.86 | 0 | |
| 14 | Nightlock SW 3 | 7-10 | 1797.19 | 92 | Southwest | NorCal | 1926.52 | -129.33 | -0.07 | |
| 15 | Grit | 7-5 | 1772.2 | 90 | Mid-Atlantic | Capital | 1791.21 | -19.02 | -0.01 | |
| 16 | LOL | 9-3 | 1760.28 | 93 | Southwest | NorCal | 1595.97 | 164.31 | 0.1 | |
| 17 | Dark Sky | 8-4 | 1732.15 | 91 | Northwest | Big Sky | 1599.97 | 132.19 | 0.08 | |
| 18 | Nemesis GL 1 | 4-8 | 1674.9 | 89 | Great Lakes | Central Plains | 1824.52 | -149.62 | -0.08 | |
| 19 | Starling Ultimate | 3-7 | 1635.36 | 89 | Northeast | West New England | 1811.4 | -176.04 | -0.1 | |
| 20 | Pop NC 1 | 6-6 | 1605.83 | 91 | North Central | Northwest Plains | 1604.22 | 1.61 | 0 | |
| 21 | Flight | 5-7 | 1536.77 | 88 | Mid-Atlantic | Founders | 1560.02 | -23.26 | -0.01 | |
| 22 | FMP-PE | 6-0 | 1509.18 | 84 | 930.3 | 578.88 | 0.62 | |||
| 23 | Vengeance | 14-4 | 1462.9 | 85 | South Central | Texas | 1195.15 | 267.75 | 0.22 | |
| 24 | Wildfire | 10-2 | 1457.03 | 97 | Southwest | So Cal | 1177 | 280.03 | 0.24 | |
| 25 | Underground | 6-6 | 1422.85 | 96 | Northwest | Washington/BC | 1431.6 | -8.76 | -0.01 | |
| 26 | Siege | 8-4 | 1393.49 | 83 | Northeast | East New England | 1109.04 | 284.45 | 0.26 | |
| 27 | Colorado Kelp | 5-7 | 1390.18 | 97 | South Central | Rocky Mountain | 1332.2 | 57.98 | 0.04 | |
| 28 | Fusion | 6-1 | 1377.11 | 84 | 1003.96 | 373.14 | 0.37 | |||
| 29 | Heist | 11-8 | 1295.24 | 85 | North Central | Northwest Plains | 1321.05 | -25.81 | -0.02 | |
| 30 | Indy Rogue | 13-5 | 1282.36 | 83 | Great Lakes | Central Plains | 1076.33 | 206.03 | 0.19 | |
| 31 | Oregon Downpour | 3-2 | 1263.7 | 110 | 1036.8 | 226.9 | 0.22 | |||
| 32 | Colorado Small Batch | 2-10 | 1234.07 | 91 | South Central | Rocky Mountain | 1374.27 | -140.2 | -0.1 | |
| 33 | Ozone | 10-3 | 1225.02 | 83 | Southeast | East Coast | 1066.38 | 158.64 | 0.15 | |
| 34 | Vice | 10-2 | 1216.05 | 80 | Northeast | East New England | 849.63 | 366.42 | 0.43 | |
| 35 | Wicked | 16-3 | 1200.2 | 84 | North Central | West Plains | 957.22 | 242.98 | 0.25 | |
| 36 | Outrage | 10-9 | 1144.85 | 85 | Great Lakes | East Plains | 1142.65 | 2.19 | 0 | |
| 37 | Toronto Incognito | 4-1 | 1131.85 | 83 | 755.05 | 376.8 | 0.5 | |||
| 38 | Crush City | 12-6 | 1129.79 | 87 | South Central | Texas | 927.55 | 202.25 | 0.22 | |
| 39 | Brooklyn Book Club | 7-10 | 1115.5 | 84 | Northeast | Metro NY | 1165.82 | -50.32 | -0.04 | |
| 40 | Hucklebears | 3-3 | 1109.43 | 106 | 1191.93 | -82.5 | -0.07 | |||
| 41 | 1 | FAB | 9-11 | 1092.72 | 104 | Southwest | NorCal | 1128.85 | -36.13 | -0.03 |
| 42 | 1 | Juice Box | 12-6 | 1078.44 | 80 | Southeast | North Carolina | 939.99 | 138.45 | 0.15 |
| 43 | Tabby Rosa | 6-6 | 1047.82 | 80 | Southeast | Florida | 1052.84 | -5.02 | 0 | |
| 44 | 1 | Seattle END | 8-4 | 1041.26 | 116 | Northwest | Washington/BC | 917.1 | 124.16 | 0.14 |
| 45 | 1 | San Antonio Problems | 10-8 | 1021.51 | 82 | South Central | Texas | 943.15 | 78.36 | 0.08 |
| 46 | Agency | 8-9 | 1005.95 | 83 | Mid-Atlantic | Capital | 1072.53 | -66.59 | -0.06 | |
| 47 | Zephyr | 8-4 | 990.73 | 82 | Mid-Atlantic | Founders | 868.47 | 122.26 | 0.14 | |
| 48 | Shiver | 9-8 | 970.32 | 83 | Southeast | North Carolina | 997.71 | -27.39 | -0.03 | |
| 49 | CHAOS | 7-5 | 965.48 | 80 | Southeast | East Coast | 926.76 | 38.73 | 0.04 | |
| 50 | Trainwreck | 10-2 | 933.18 | 92 | South Central | Rocky Mountain | 843.79 | 89.39 | 0.11 | |
| 51 | NE Potato Chowder | 2-1 | 913.44 | 81 | 821.62 | 91.82 | 0.11 | |||
| 52 | 2 | Drift | 4-8 | 876.35 | 106 | Northwest | Washington/BC | 1023.11 | -146.76 | -0.14 |
| 53 | Void Cat Rewind | 8-7 | 874.57 | 100 | Southwest | NorCal | 899.67 | -25.09 | -0.03 | |
| 54 | 2 | Frolic | 2-1 | 862.63 | 81 | 825.94 | 36.69 | 0.04 | ||
| 55 | Wave | 7-3 | 850.4 | 80 | Mid-Atlantic | Capital | 712.45 | 137.94 | 0.19 | |
| 56 | Hayride | 3-4 | 843.36 | 84 | 863.81 | -20.45 | -0.02 | |||
| 57 | Pine Baroness | 5-11 | 831.08 | 83 | Mid-Atlantic | Founders | 1020.81 | -189.73 | -0.19 | |
| 58 | Pizza Rat | 9-9 | 812.59 | 81 | Northeast | Metro NY | 873.12 | -60.54 | -0.07 | |
| 59 | Stellar | 9-10 | 755.65 | 84 | North Central | West Plains | 856.79 | -101.13 | -0.12 | |
| 60 | 2 | PDXtra | 2-2 | 734.84 | 112 | 667.38 | 67.46 | 0.1 | ||
| 61 | 1 | Calypso | 6-6 | 720.21 | 76 | Southeast | Florida | 733.22 | -13.02 | -0.02 |
| 62 | 1 | Magma | 8-5 | 711.59 | 77 | Southeast | East Coast | 662.07 | 49.52 | 0.07 |
| 63 | Y'all | 3-3 | 682.45 | 82 | 714.88 | -32.43 | -0.05 | |||
| 64 | Virginia Rebellion | 7-11 | 673.75 | 78 | Mid-Atlantic | Capital | 855.8 | -182.06 | -0.21 | |
| 65 | 1 | Rampage | 6-6 | 670.41 | 145 | Southwest | So Cal | 679.38 | -8.98 | -0.01 |
| 66 | 1 | Venom | 7-2 | 608.27 | 81 | 270.24 | 338.03 | 1.25 | ||
| 67 | Lake Erie Walleye | 4-8 | 578.35 | 83 | Great Lakes | East Plains | 794.6 | -216.25 | -0.27 | |
| 68 | Inferno | 1-5 | 565.02 | 84 | 1003.01 | -437.99 | -0.44 | |||
| 69 | Dish | 7-12 | 552.64 | 84 | Great Lakes | Central Plains | 756.13 | -203.49 | -0.27 | |
| 70 | TWISTED | 3-9 | 537.86 | 81 | South Central | Texas | 762.56 | -224.7 | -0.29 | |
| 71 | 1 | Sureshot | 3-8 | 508.46 | 81 | Great Lakes | East Plains | 726.47 | -218.01 | -0.3 |
| 72 | 1 | Colorado Cutthroat U-20 Girls | 4-2 | 486.7 | 80 | 349.74 | 136.96 | 0.39 | ||
| 73 | 2 | Fiasco | 4-8 | 484.23 | 46 | Southeast | Florida | 665.99 | -181.76 | -0.27 |
| 74 | 1 | Radiant [Senior] | 1-5 | 483.12 | 123 | 761.93 | -278.81 | -0.37 | ||
| 75 | 1 | Rogue | 1-3 | 452.73 | 79 | 501.99 | -49.26 | -0.1 | ||
| 76 | Versa | 1-11 | 425.67 | 81 | Northeast | East New England | 907.41 | -481.74 | -0.53 | |
| 77 | Huntsville Laika | 1-5 | 392.06 | 80 | 691.02 | -298.96 | -0.43 | |||
| 78 | Incline | 4-3 | 336.81 | 81 | 420.26 | -83.45 | -0.2 | |||
| 79 | 1 | Portland Rain Check | 2-15 | 292.98 | 98 | Northwest | Oregon | 598.14 | -305.16 | -0.51 |
| 80 | 1 | Stormborn | 5-8 | 292.47 | 84 | North Central | Northwest Plains | 370.46 | -78 | -0.21 |
| 81 | Medusa | 4-9 | 262.01 | 84 | North Central | Northwest Plains | 332.76 | -70.76 | -0.21 | |
| 82 | Firewheel | 0-6 | 193.25 | 83 | 713.54 | -520.29 | -0.73 | |||
| 83 | 1 | Seattle Soul | 4-14 | 177.86 | 127 | Northwest | Washington/BC | 437.01 | -259.14 | -0.59 |
| 84 | 1 | Swell | 7-5 | 147.55 | 61 | Northwest | Big Sky | -9.61 | 157.17 | -16.35 |
| 85 | 1 | Solstice | 1-4 | 123.25 | 83 | 468.67 | -345.43 | -0.74 | ||
| 86 | 1 | Roseate Spoonbill | 0-6 | 112.47 | 68 | 630.26 | -517.79 | -0.82 | ||
| 87 | Haboob | 6-10 | 99.01 | 85 | Southwest | So Cal | 194.82 | -95.81 | -0.49 | |
| - | Bullseye | 0-2 | 67.29 | 83 | 627.55 | -560.26 | -0.89 | |||
| 88 | Dissent | 2-10 | 18.25 | 79 | Mid-Atlantic | Capital | 145.11 | -126.87 | -0.87 | |
| 89 | COSMOS | 2-4 | -34.36 | 80 | 163.81 | -198.16 | -1.21 | |||
| 90 | 2 | Freshwater Ultimate | 2-11 | -193.59 | 84 | North Central | Northwest Plains | 0.36 | -193.94 | -541.02 |
| 91 | Ultraviolet | 2-3 | -230.98 | 10 | -355.36 | 124.39 | -0.35 | |||
| 92 | 2 | Tempo | 2-9 | -279.19 | 44 | Southwest | NorCal | -122.62 | -156.57 | 1.28 |
| 93 | Pickup Lines | 1-6 | -360.95 | 80 | -54.14 | -306.8 | 5.67 | |||
| 94 | Just Add Water | 1-16 | -473.61 | 92 | Southwest | So Cal | -21.88 | -451.73 | 20.65 | |
| 95 | Charm | 1-12 | -517.67 | 84 | North Central | West Plains | -73.95 | -443.72 | 6 | |
| 96 | Syrup! | 0-5 | -575.2 | 79 | -182.77 | -392.43 | 2.15 |
FAQ
The results on this page ("USAU") are the results of an implementation of the USA Ultimate Top 20 algorithm, which is used to allocate post season bids to both colleg and club ultimate teams. The data was obtained by scraping USAU's score reporting website. Learn more about the algorithm here. TL;DR, here is the rating function. Every game a team plays gets a rating equal to the opponents rating +/- the score value. With all these data points, we iterate team ratings until convergence. There is also a rule for discounting blowout games (see next FAQ)
For reference, here is handy table with frequent game scrores and the resulting game value: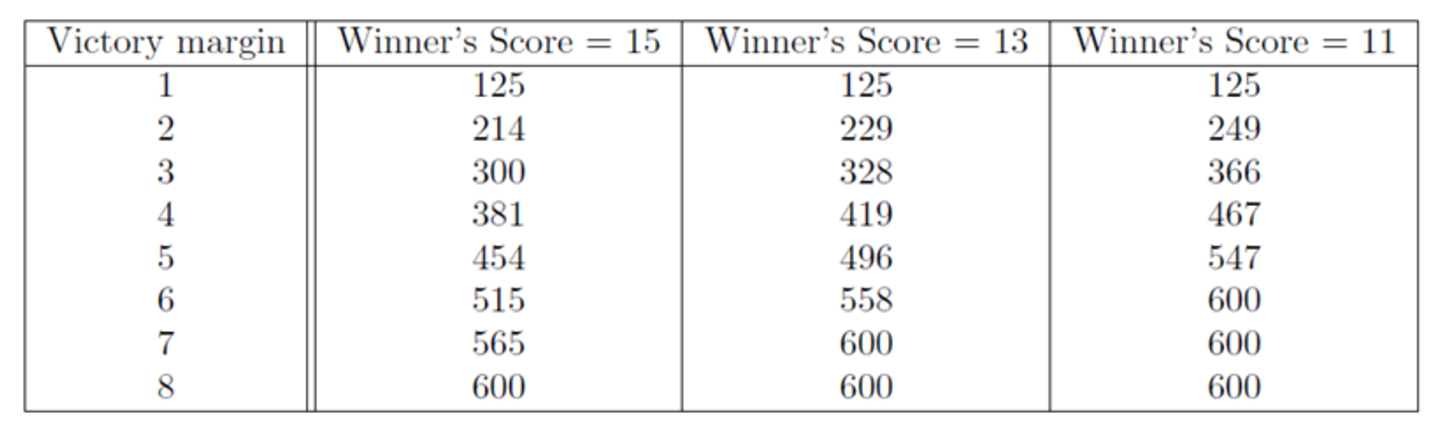
For reference, here is handy table with frequent game scrores and the resulting game value:
"...if a team is rated more than 600 points higher than its opponent, and wins with a score that is more than twice the losing score plus one, the game is ignored for ratings purposes. However, this is only done if the winning team has at least N other results that are not being ignored, where N=5."
Translation: if a team plays a game where even earning the max point win would hurt them, they can have the game ignored provided they win by enough and have suffficient unignored results.
Translation: if a team plays a game where even earning the max point win would hurt them, they can have the game ignored provided they win by enough and have suffficient unignored results.