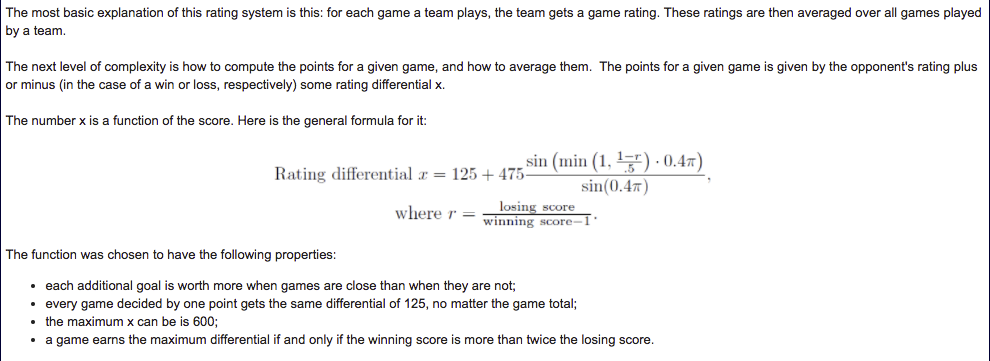
D-III College Men's USAU Rankings
2024-25 Season
Data updated through May 4 at 8:45pm EDT (some scores likely missing)
AC 2 · GL 1 · ME 2 · NE 2 · NC 2 · NW 2 · OV 1 · SC 2 · SE 1 · SW 1
| Rank | Change | Team | Record | Rating | Change | Region | Conference | Div | SoS | PDC | % |
|---|---|---|---|---|---|---|---|---|---|---|---|
| 1 [15] | Davenport GL 1 | 25-1 | 2041.09 | 19 | Great Lakes | Great Lakes DIII | D-III | 1530.89 | 510.2 | 0.33 | |
| 2 [33] | Elon AC 1 | 24-5 | 1825.66 | 17 | Atlantic Coast | Atlantic Coast DIII | D-III | 1516.53 | 309.14 | 0.2 | |
| 3 [36] | 4 | Lewis & Clark NW 1 | 20-3 | 1797.06 | 11 | Northwest | Northwest DIII | D-III | 1446.24 | 350.83 | 0.24 |
| 4 [40] | 4 | Middlebury NE 1 | 21-5 | 1774.28 | 45 | New England | North New England DIII | D-III | 1480.83 | 293.46 | 0.2 |
| 5 [43] | Whitman NW 2 | 11-4 | 1764.88 | 19 | Northwest | Northwest DIII | D-III | 1544.29 | 220.6 | 0.14 | |
| 6 [57] | Oklahoma Christian SC 1 | 19-7 | 1656.39 | 17 | South Central | Ozarks DIII | D-III | 1498.9 | 157.49 | 0.11 | |
| 7 [60] | Carleton College-CHOP NC 1 | 23-5 | 1646.37 | 16 | North Central | Northwoods DIII | D-III | 1359.42 | 286.96 | 0.21 | |
| 8 [66] | 1 | Franciscan OV 1 | 19-4 | 1623.97 | 14 | Ohio Valley | Ohio DIII | D-III | 1311.86 | 312.12 | 0.24 |
| 9 [72] | St Olaf NC 2 | 26-9 | 1589.88 | 17 | North Central | Northwoods DIII | D-III | 1348.1 | 241.79 | 0.18 | |
| 10 [73] | 2 | Wesleyan ME 1 | 16-6 | 1587.29 | 12 | Metro East | Hudson Valley DIII | D-III | 1296.44 | 290.88 | 0.22 |
| 11 [77] | 1 | Richmond AC 2 | 16-11 | 1564.2 | 18 | Atlantic Coast | Atlantic Coast DIII | D-III | 1450.24 | 113.98 | 0.08 |
| 12 [80] | 4 | Williams NE 2 | 19-9 | 1539.38 | 53 | New England | South New England DIII | D-III | 1410.83 | 128.57 | 0.09 |
| 13 [81] | Rochester ME 2 | 16-5 | 1538.5 | 17 | Metro East | Western NY DIII | D-III | 1336.8 | 201.72 | 0.15 | |
| 14 [87] | Missouri S&T SC 2 | 23-8 | 1491.08 | 16 | South Central | Ozarks DIII | D-III | 1315.16 | 175.93 | 0.13 | |
| 15 [89] | Colorado College | 18-8 | 1485.28 | 12 | South Central | Rocky Mountain DIII | D-III | 1402.8 | 82.49 | 0.06 | |
| 16 [90] | 5 | Bowdoin | 24-4 | 1478.93 | 1 | New England | North New England DIII | D-III | 1240.37 | 238.57 | 0.19 |
| 17 [101] | 1 | North Carolina-Asheville | 12-6 | 1448.36 | 12 | Atlantic Coast | Atlantic Coast DIII | D-III | 1362.47 | 85.9 | 0.06 |
| 18 [103] | 2 | Berry SE 1 | 19-3 | 1444.9 | 18 | Southeast | Southeast DIII | D-III | 1137.38 | 307.56 | 0.27 |
| 19 [107] | Claremont SW 1 | 10-4 | 1428.35 | 16 | Southwest | Southwest DIII | D-III | 1281.08 | 147.28 | 0.11 | |
| 20 [117] | 1 | Colorado Mines | 15-9 | 1363.26 | 9 | South Central | Rocky Mountain DIII | D-III | 1219.76 | 143.5 | 0.12 |
| 21 [123] | 10 | Bates | 16-13 | 1344.49 | 19 | New England | North New England DIII | D-III | 1349.93 | -5.43 | 0 |
| 22 [127] | 2 | Butler | 17-9 | 1335.19 | 16 | Great Lakes | East Plains DIII | D-III | 1168.85 | 166.36 | 0.14 |
| 23 [132] | 1 | Kenyon | 16-8 | 1315.76 | 14 | Ohio Valley | Ohio DIII | D-III | 1218.72 | 97.04 | 0.08 |
| 24 [141] | 2 | Puget Sound | 12-10 | 1288.06 | 17 | Northwest | Northwest DIII | D-III | 1231.45 | 56.62 | 0.05 |
| 25 [143] | 1 | Davidson | 14-10 | 1278.6 | 13 | Atlantic Coast | Atlantic Coast DIII | D-III | 1231.1 | 47.54 | 0.04 |
| 26 [144] | 1 | Oberlin | 18-8 | 1270.28 | 15 | Ohio Valley | Ohio DIII | D-III | 1156.98 | 113.33 | 0.1 |
| 27 [151] | 1 | Macalester | 15-14 | 1261.32 | 16 | North Central | Northwoods DIII | D-III | 1277.18 | -15.86 | -0.01 |
| 28 [152] | 1 | Lipscomb | 7-7 | 1253.36 | 19 | Southeast | Southeast DIII | D-III | 1209.36 | 44.01 | 0.04 |
| 29 [158] | Grinnell | 10-7 | 1220.19 | 14 | North Central | West Plains DIII | D-III | 1159.03 | 61.22 | 0.05 | |
| 30 [159] | 3 | Brandeis | 16-10 | 1217.2 | 11 | New England | Metro Boston DIII | D-III | 1028.73 | 188.48 | 0.18 |
| 31 [161] | 1 | Ithaca | 17-11 | 1215.04 | 16 | Metro East | Western NY DIII | D-III | 1164.93 | 50.12 | 0.04 |
| 32 [164] | 1 | Truman State | 19-9 | 1207.14 | 15 | South Central | Ozarks DIII | D-III | 1117.21 | 89.94 | 0.08 |
| 33 [169] | Michigan Tech | 13-15 | 1188.6 | 15 | North Central | Lake Superior DIII | D-III | 1130.5 | 58.13 | 0.05 | |
| 34 [170] | Messiah | 12-15 | 1183.27 | 12 | Ohio Valley | West Penn DIII | D-III | 1206.51 | -23.22 | -0.02 | |
| 35 [178] | 1 | Dickinson | 10-18 | 1152.8 | 13 | Ohio Valley | West Penn DIII | D-III | 1237.97 | -85.17 | -0.07 |
| 36 [186] | 1 | Union (Tennessee) | 12-12 | 1112.59 | 17 | Southeast | Southeast DIII | D-III | 1007.11 | 105.5 | 0.1 |
| 37 [195] | 1 | John Brown | 9-11 | 1069.63 | 16 | South Central | Ozarks DIII | D-III | 1158.83 | -89.18 | -0.08 |
| 38 [196] | 1 | Haverford | 18-12 | 1068.39 | 10 | Ohio Valley | East Penn DIII | D-III | 998.15 | 70.31 | 0.07 |
| 39 [199] | Occidental | 7-7 | 1058.14 | 17 | Southwest | Southwest DIII | D-III | 1068.59 | -10.44 | -0.01 | |
| 40 [206] | 2 | Winona State | 14-9 | 1032.17 | 14 | North Central | Northwoods DIII | D-III | 948.54 | 83.68 | 0.09 |
| 41 [212] | 3 | Cedarville | 8-15 | 1015.17 | 16 | Ohio Valley | Ohio DIII | D-III | 1078.69 | -63.51 | -0.06 |
| 42 [220] | 1 | Christopher Newport | 6-13 | 981.36 | 14 | Atlantic Coast | Atlantic Coast DIII | D-III | 1198.53 | -217.18 | -0.18 |
| 43 [227] | 2 | Ave Maria-B | 3-2 | 946.89 | 11 | Southeast | Southeast DIII | D-III | 575.68 | 371.22 | 0.64 |
| 44 [228] | Embry-Riddle | 6-5 | 945.96 | 16 | Southeast | Southeast DIII | D-III | 870.03 | 75.94 | 0.09 | |
| 45 [230] | 1 | Air Force | 4-14 | 927.9 | 14 | South Central | Rocky Mountain DIII | D-III | 1197.48 | -269.56 | -0.23 |
| 46 [231] | 8 | Colby | 11-12 | 927.19 | 56 | New England | North New England DIII | D-III | 1068.74 | -141.54 | -0.13 |
| 47 [235] | Skidmore | 15-12 | 915.2 | 12 | Metro East | Hudson Valley DIII | D-III | 911.35 | 3.93 | 0 | |
| 48 [241] | Xavier | 2-17 | 899.56 | 14 | Ohio Valley | Ohio DIII | D-III | 1205.26 | -305.69 | -0.25 | |
| 49 [242] | Grace | 9-12 | 896.1 | 14 | Great Lakes | D-III | 850.1 | 46.04 | 0.05 | ||
| 50 [243] | 1 | College of New Jersey | 10-7 | 893.37 | 9 | Metro East | Metro NY DIII | D-III | 801.79 | 91.66 | 0.11 |
| 51 [246] | 1 | Connecticut College | 11-6 | 885.45 | 4 | Metro East | Hudson Valley DIII | D-III | 762.8 | 122.7 | 0.16 |
| 52 [250] | 31 | Worcester Polytechnic | 10-12 | 867.13 | 103 | New England | South New England DIII | D-III | 870.17 | -3.03 | 0 |
| 53 [251] | 1 | Portland | 8-12 | 864.06 | 20 | Northwest | Northwest DIII | D-III | 952.64 | -88.56 | -0.09 |
| 54 [252] | 1 | Seattle | 3-2 | 858.11 | 20 | Northwest | Northwest DIII | D-III | 696.57 | 161.55 | 0.23 |
| 55 [256] | 3 | St Thomas | 9-14 | 848.88 | 14 | North Central | Northwoods DIII | D-III | 909.85 | -60.97 | -0.07 |
| 56 [261] | 2 | Florida Tech | 6-3 | 830.03 | 14 | Southeast | Southeast DIII | D-III | 745.85 | 84.19 | 0.11 |
| 57 [267] | SUNY-Geneseo | 10-15 | 799.71 | 10 | Metro East | Western NY DIII | D-III | 878.74 | -78.98 | -0.09 | |
| 58 [271] | 5 | Wisconsin-Platteville | 5-15 | 795.62 | 16 | North Central | Lake Superior DIII | D-III | 1018.66 | -223.02 | -0.22 |
| 59 [272] | 1 | Wooster | 4-2 | 792.52 | 14 | Ohio Valley | Ohio DIII | D-III | 712.6 | 79.89 | 0.11 |
| 60 [275] | 31 | Bryant | 4-2 | 776.95 | 111 | New England | South New England DIII | D-III | 717.41 | 59.56 | 0.08 |
| 61 [276] | 2 | St John's (Minnesota) | 5-11 | 772.54 | 16 | North Central | Northwoods DIII | D-III | 922.85 | -151.03 | -0.16 |
| 62 [277] | Salisbury | 9-7 | 769.52 | 10 | Atlantic Coast | Atlantic Coast DIII | D-III | 827.3 | -58.01 | -0.07 | |
| 63 [285] | 3 | Navy | 1-14 | 750.44 | 13 | Atlantic Coast | Atlantic Coast DIII | D-III | 1097.14 | -346.65 | -0.32 |
| 64 [288] | 4 | Harding | 8-28 | 745.34 | 16 | South Central | Ozarks DIII | D-III | 1034.52 | -289.17 | -0.28 |
| 65 [291] | 3 | Carleton College-C | 3-7 | 724.27 | 15 | North Central | Northwoods DIII | D-III | 947.68 | -223.18 | -0.24 |
| 66 [292] | 2 | Mary Washington | 2-8 | 722.23 | 12 | Atlantic Coast | Atlantic Coast DIII | D-III | 927.3 | -205.03 | -0.22 |
| 67 [293] | 19 | Amherst | 8-14 | 721.01 | 92 | New England | South New England DIII | D-III | 778.8 | -57.78 | -0.07 |
| 68 [295] | 4 | Reed | 6-11 | 713.31 | 18 | Northwest | Northwest DIII | D-III | 837.28 | -123.96 | -0.15 |
| 69 [296] | 3 | Trinity | 7-13 | 711.59 | 17 | South Central | Texas DIII | D-III | 765.71 | -54.11 | -0.07 |
| 70 [298] | 1 | Knox | 6-10 | 696.55 | 14 | Great Lakes | Illinois DIII | D-III | 674.75 | 21.01 | 0.03 |
| 71 [303] | 2 | Luther | 8-10 | 665.96 | 15 | North Central | West Plains DIII | D-III | 749.77 | -83.83 | -0.11 |
| 72 [309] | 2 | Whitworth | 3-6 | 636.65 | 20 | Northwest | Northwest DIII | D-III | 783.08 | -146.42 | -0.19 |
| 73 [310] | 38 | Bentley | 2-10 | 636.01 | 178 | New England | Metro Boston DIII | D-III | 982.45 | -346.43 | -0.35 |
| 74 [311] | 1 | Swarthmore | 5-4 | 632.71 | 5 | Ohio Valley | East Penn DIII | D-III | 634.71 | -2.35 | 0 |
| 75 [317] | 3 | Willamette | 3-5 | 606.53 | 19 | Northwest | Northwest DIII | D-III | 590.83 | 15.71 | 0.03 |
| 76 [319] | 4 | Pacific Lutheran | 4-12 | 601.14 | 18 | Northwest | Northwest DIII | D-III | 761.73 | -160.58 | -0.21 |
| 77 [326] | 2 | Samford | 3-4 | 584.13 | 14 | Southeast | Western Southeast DIII | D-III | 591.21 | -7.08 | -0.01 |
| 78 [327] | 4 | Rice | 5-8 | 582.11 | 17 | South Central | Texas DIII | D-III | 643.15 | -61.02 | -0.09 |
| 79 [330] | 2 | SUNY-Cortland | 4-17 | 571.4 | 10 | Metro East | Western NY DIII | D-III | 911.54 | -340.41 | -0.37 |
| 80 [338] | 4 | Penn State-Behrend | 3-5 | 548.76 | 13 | Ohio Valley | West Penn DIII | D-III | 785.44 | -236.66 | -0.3 |
| 81 [340] | 2 | Rose-Hulman | 5-19 | 529.44 | 13 | Great Lakes | D-III | 815.15 | -285.66 | -0.35 | |
| 82 [349] | 2 | Rensselaer Polytech | 5-18 | 454.88 | 6 | Metro East | Hudson Valley DIII | D-III | 870.81 | -415.9 | -0.48 |
| 83 [350] | 12 | Western New England | 2-9 | 445.55 | 77 | New England | South New England DIII | D-III | 544.79 | -99.25 | -0.18 |
| 84 [355] | 3 | Army | 2-9 | 413.85 | 3 | Metro East | Hudson Valley DIII | D-III | 767.45 | -353.47 | -0.46 |
| 85 [356] | 3 | Lehigh-B | 5-8 | 411.44 | 2 | Ohio Valley | East Penn DIII | D-III | 539.67 | -128.13 | -0.24 |
| 86 [364] | 5 | Georgia College | 1-14 | 376.99 | 16 | Southeast | Southeast DIII | D-III | 811.79 | -434.78 | -0.54 |
| 87 [368] | 1 | Dallas | 4-12 | 329.59 | 17 | South Central | Texas DIII | D-III | 495.96 | -166.35 | -0.34 |
| 88 [385] | 1 | Carthage | 1-11 | 203.76 | 16 | North Central | Lake Superior DIII | D-III | 702.09 | -498.33 | -0.71 |
| 89 [389] | Stevens Tech | 7-13 | 186.02 | 1 | Metro East | Metro NY DIII | D-III | 209.93 | -23.72 | -0.11 | |
| 90 [391] | Colorado Mines-B | 0-6 | 153.99 | 2 | South Central | Rocky Mountain DIII | D-III | 480.98 | -326.97 | -0.68 | |
| 91 [392] | 7 | Middlebury-B | 1-9 | 138.34 | 52 | New England | North New England DIII | D-III | 280.02 | -141.67 | -0.51 |
| 92 [405] | 1 | Dartmouth-B | 1-7 | -33.81 | 11 | New England | North New England DIII | D-III | 304.96 | -338.75 | -1.11 |
| 93 [416] | 1 | Siena | 0-11 | -413.82 | 1 | Metro East | Hudson Valley DIII | D-III | 186.02 | -600 | -3.23 |
| 94 [417] | 1 | Denison | 0-5 | -417.15 | 14 | Ohio Valley | Ohio DIII | D-III | 100.86 | -517.96 | -5.14 |
FAQ
The results on this page ("USAU") are the results of an implementation of the USA Ultimate Top 20 algorithm, which is used to allocate post season bids to both colleg and club ultimate teams. The data was obtained by scraping USAU's score reporting website. Learn more about the algorithm here. TL;DR, here is the rating function. Every game a team plays gets a rating equal to the opponents rating +/- the score value. With all these data points, we iterate team ratings until convergence. There is also a rule for discounting blowout games (see next FAQ)
For reference, here is handy table with frequent game scrores and the resulting game value: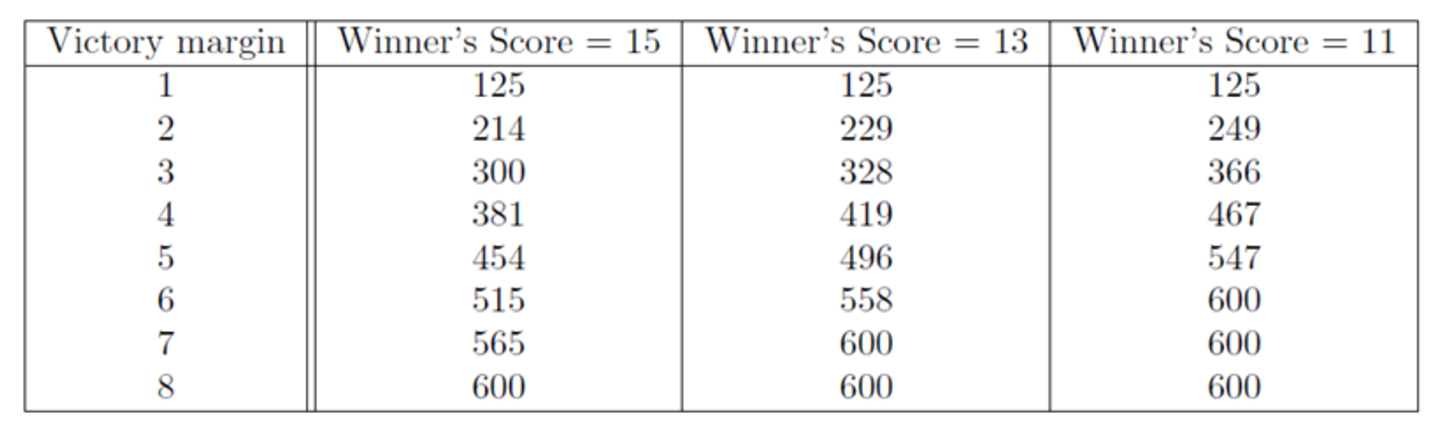
For reference, here is handy table with frequent game scrores and the resulting game value:
"...if a team is rated more than 600 points higher than its opponent, and wins with a score that is more than twice the losing score plus one, the game is ignored for ratings purposes. However, this is only done if the winning team has at least N other results that are not being ignored, where N=5."
Translation: if a team plays a game where even earning the max point win would hurt them, they can have the game ignored provided they win by enough and have suffficient unignored results.
Translation: if a team plays a game where even earning the max point win would hurt them, they can have the game ignored provided they win by enough and have suffficient unignored results.