College Women's USAU Rankings (SW)
2024-25 Season
Data updated through June 30 at 11:00pm EDT (everyone is in a bubble)
| Rank | Change | Team | Record | Rating | Change | Region | Conference | Div | SoS | PDC | % |
|---|---|---|---|---|---|---|---|---|---|---|---|
| 8 | Stanford SW 1 | 22-12 | 2134.37 | 0 | Southwest | NorCal DI | D-I | 2037.36 | 97.03 | 0.05 | |
| 10 | California-San Diego SW 2 | 23-16 | 2115.57 | 2 | Southwest | SoCal DI | D-I | 2010.45 | 105.13 | 0.05 | |
| 12 | 1 | Cal Poly-SLO SW 3 | 26-12 | 2083.14 | 3 | Southwest | SoCal DI | D-I | 2049.55 | 33.6 | 0.02 |
| 13 | 1 | California-Santa Barbara SW 4 | 20-9 | 2067.73 | 2 | Southwest | SoCal DI | D-I | 1918.97 | 148.76 | 0.08 |
| 14 | 1 | California-Santa Cruz SW 5 | 18-12 | 2041.54 | 2 | Southwest | NorCal DI | D-I | 1961.55 | 80 | 0.04 |
| 23 | California-Davis | 15-17 | 1875.64 | 5 | Southwest | NorCal DI | D-I | 1852.74 | 22.91 | 0.01 | |
| 30 | UCLA | 21-23 | 1714.42 | 4 | Southwest | SoCal DI | D-I | 1798.38 | -83.96 | -0.05 | |
| 40 | California | 17-15 | 1581.98 | 0 | Southwest | NorCal DI | D-I | 1670.01 | -88.02 | -0.05 | |
| 41 | Southern California | 14-18 | 1572.33 | 1 | Southwest | SoCal DI | D-I | 1728.7 | -156.37 | -0.09 | |
| 68 | Santa Clara | 16-12 | 1296.47 | 4 | Southwest | NorCal DI | D-I | 1250.38 | 46.1 | 0.04 | |
| 77 | 1 | Grand Canyon | 13-5 | 1216.4 | 3 | Southwest | Desert DI | D-I | 1000.38 | 216 | 0.22 |
| 82 | 1 | California-Irvine | 23-12 | 1190.17 | 5 | Southwest | SoCal DI | D-I | 1061.27 | 128.91 | 0.12 |
| 105 | 1 | San Diego State | 15-12 | 1035.81 | 4 | Southwest | SoCal DI | D-I | 1001.9 | 33.89 | 0.03 |
| 114 | Arizona State | 16-14 | 951.81 | 4 | Southwest | Desert DI | D-I | 987.06 | -35.3 | -0.04 | |
| 123 | California-San Diego-B | 17-13 | 910.49 | 5 | Southwest | Southwest Dev | Dev | 827.61 | 82.87 | 0.1 | |
| 132 | 2 | Northern Arizona | 4-8 | 813.01 | 4 | Southwest | Desert DI | D-I | 978.75 | -165.76 | -0.17 |
| 133 | Claremont | 11-10 | 811.23 | 12 | Southwest | Southwest DIII | D-III | 773.79 | 37.45 | 0.05 | |
| 139 | 2 | Stanford-B | 1-5 | 742.26 | 3 | Southwest | Southwest Dev | Dev | 1072.13 | -329.86 | -0.31 |
| 143 | California-B | 5-6 | 726.7 | 7 | Southwest | Southwest Dev | Dev | 738.09 | -11.38 | -0.02 | |
| 146 | 1 | Claremont-B | 1-2 | 724.06 | 5 | Southwest | ? | 837.39 | -113.31 | -0.14 | |
| 164 | 1 | Cal Poly-SLO-B | 7-14 | 630.95 | 5 | Southwest | Southwest Dev | Dev | 844.88 | -213.92 | -0.25 |
| 178 | Nevada-Reno | 5-12 | 555.8 | 8 | Southwest | NorCal DI | D-I | 681.37 | -125.55 | -0.18 | |
| 181 | 1 | Arizona | 6-14 | 532.91 | 5 | Southwest | Desert DI | D-I | 679.08 | -146.23 | -0.22 |
| 183 | 1 | Occidental | 5-6 | 525.62 | 9 | Southwest | Southwest DIII | D-III | 673.43 | -147.8 | -0.22 |
| 194 | 2 | California-Davis-B | 1-5 | 468.66 | 7 | Southwest | Southwest Dev | Dev | 673.62 | -204.94 | -0.3 |
| 196 | UCLA-B | 10-13 | 462.49 | 6 | Southwest | Southwest Dev | Dev | 534.96 | -72.46 | -0.14 | |
| 218 | 1 | Cal Poly-Humboldt | 2-15 | 220.06 | 10 | Southwest | NorCal DI | D-I | 554.69 | -334.63 | -0.6 |
| 220 | Cal State-Long Beach | 5-17 | 216.03 | 7 | Southwest | SoCal DI | D-I | 286.42 | -70.38 | -0.25 | |
| 222 | California-Santa Barbara-B | 1-5 | 206.57 | 8 | Southwest | Southwest Dev | Dev | 483.14 | -276.55 | -0.57 | |
| 242 | Arizona-B | 0-6 | 40.86 | 3 | Southwest | Southwest Dev | Dev | 514.56 | -473.83 | -0.92 | |
| 249 | California-San Diego-C | 3-20 | -25.95 | 6 | Southwest | Southwest Dev | Dev | 288.55 | -314.49 | -1.09 | |
| 262 | 1 | Southern California-B | 0-7 | -563.96 | 6 | Southwest | ? | -25.95 | -537.98 | 20.73 |
FAQ
The results on this page ("USAU") are the results of an implementation of the USA Ultimate Top 20 algorithm, which is used to allocate post season bids to both colleg and club ultimate teams. The data was obtained by scraping USAU's score reporting website. Learn more about the algorithm here. TL;DR, here is the rating function. Every game a team plays gets a rating equal to the opponents rating +/- the score value. With all these data points, we iterate team ratings until convergence. There is also a rule for discounting blowout games (see next FAQ)
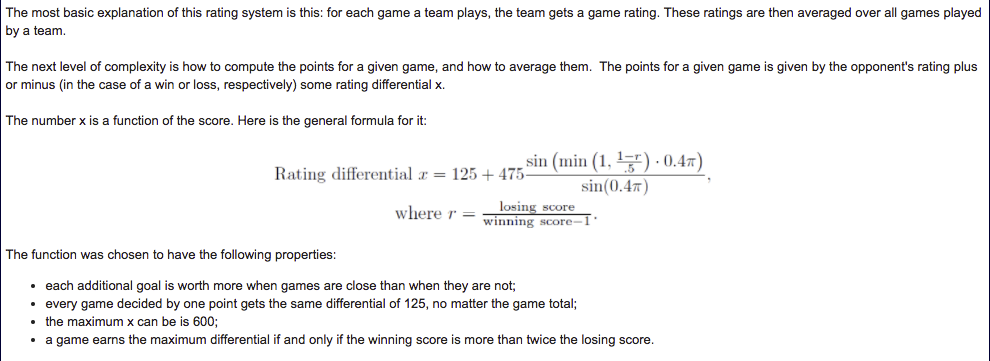
For reference, here is handy table with frequent game scrores and the resulting game value: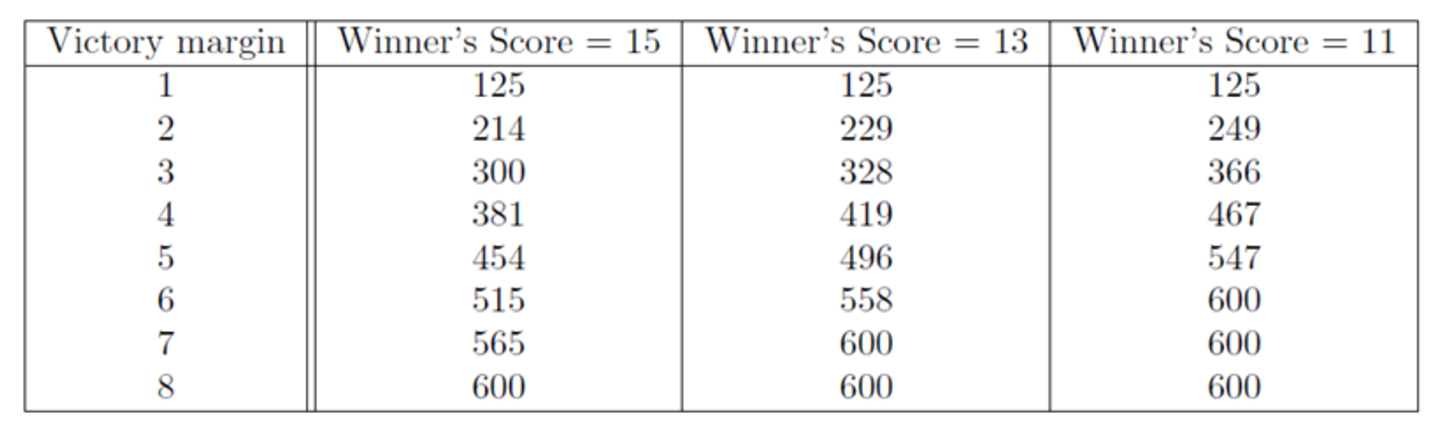
For reference, here is handy table with frequent game scrores and the resulting game value:
"...if a team is rated more than 600 points higher than its opponent, and wins with a score that is more than twice the losing score plus one, the game is ignored for ratings purposes. However, this is only done if the winning team has at least N other results that are not being ignored, where N=5."
Translation: if a team plays a game where even earning the max point win would hurt them, they can have the game ignored provided they win by enough and have suffficient unignored results.
Translation: if a team plays a game where even earning the max point win would hurt them, they can have the game ignored provided they win by enough and have suffficient unignored results.